

Is ARM now close enough to x86 that single-thread speed no longer decides server buys?
Neoverse V2 lifts instructions per cycle by about 20–40% and, with SVE2, wider pipelines, and DDR5, often delivers 1.2×–1.8× socket throughput over V1.
This post breaks down the real benchmarks, the microarchitecture changes behind those gains, and the tradeoffs—single-thread headroom, compiler maturity, memory bandwidth, and NUMA.
Thesis: V2 narrows the single-thread gap and boosts throughput and efficiency for power- or density‑focused servers, but tuning and implementation still matter.
How Neoverse V2 Shapes Real Server Performance Expectations

Neoverse V2 delivers a measurable generational leap in instruction per cycle throughput. Typical IPC improvements range from 20% to 40% over Neoverse V1, depending on workload characteristics and memory access patterns. These gains come from wider issue pipelines, larger out of order windows, and enhanced branch prediction. All architectural changes that translate directly into better single thread efficiency. Realistic sustained clock frequencies in deployed V2 implementations typically fall between 2.5 GHz and 3.5 GHz, depending on thermal envelope and process node choices. The IPC uplift is the primary driver of per core performance rather than frequency scaling. Against contemporary high frequency x86 server SKUs, Neoverse V2 narrows the single thread gap to roughly 5–25% in latency sensitive workloads. The advantage shifts toward ARM in scenarios where power budget or core density matter more than absolute single thread peak. The gap closed faster than most IT architects expected when planning migrations two years ago.
SPECintrate and SPECfprate results show V2 based systems delivering 1.2× to 1.8× the throughput of comparable core count V1 systems when measured under realistic compiler settings and production firmware. These ranges are workload sensitive. Integer heavy tasks cluster toward the lower end, while floating point and vectorized workloads can exceed the upper bound when SVE2 optimizations are applied. Single thread SPECint2017 scores typically reflect the IPC uplift directly, with gains of 10% to 35% over V1. SPECfp2017 results vary more widely. Expect 20% to 60% improvements on vector optimized kernels but more modest gains when code paths can’t leverage wider SIMD units.
Real world workload measurements align with synthetic benchmarks but add deployment specific variance. Cloud native microservices and scale out web services show 20% to 60% higher throughput per socket compared to V1 at equal power budgets, translating into 10% to 30% lower total cost of ownership in typical cloud instance comparisons. Database transaction throughput improves by 20% to 50% for OLTP workloads, with tail latency reductions driven by better single thread IPC. Java and managed runtime workloads gain 15% to 40% after JIT and garbage collection tuning. ML inference tasks see the most dramatic shifts. SVE2 optimized INT8 and FP16 inference pipelines commonly deliver 1.5× to 3× the throughput of V1 implementations, making V2 a viable CPU only inference target for smaller models and edge deployments where GPU offload isn’t justified.
Neoverse V2 Microarchitecture Foundations for Server Class Workloads
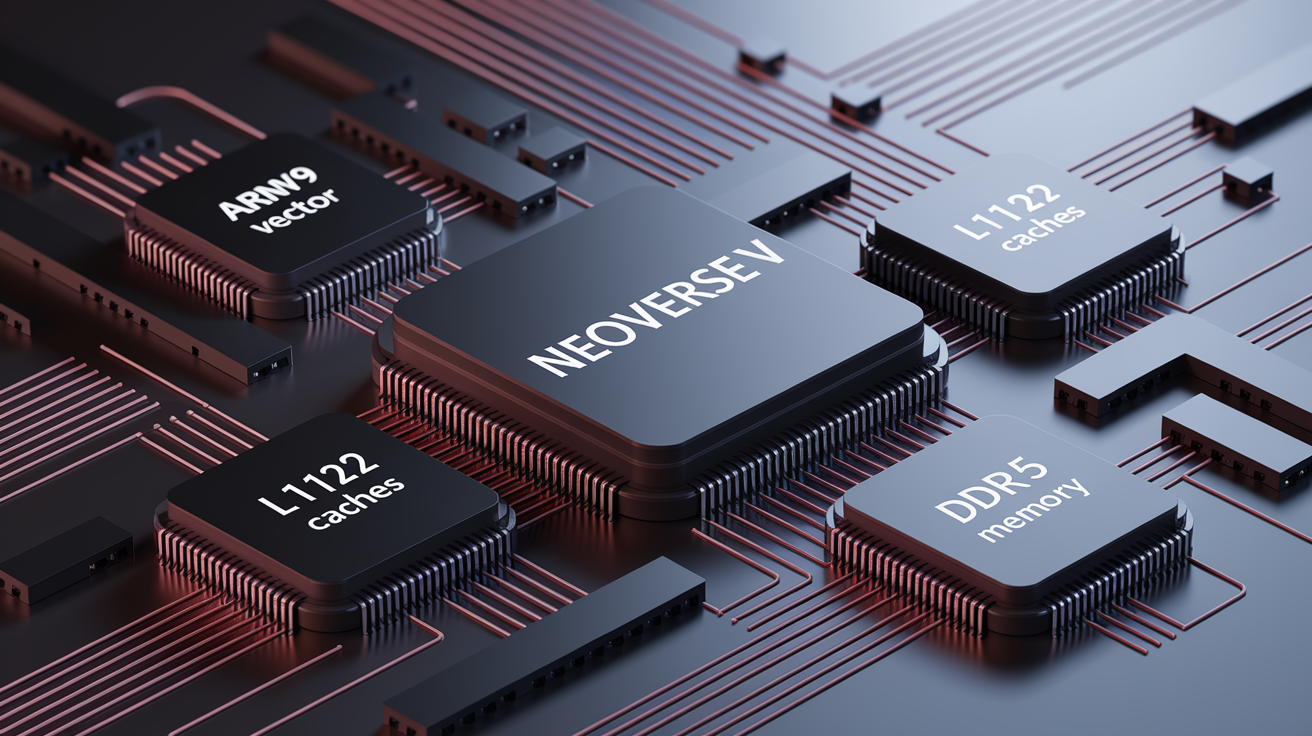
Neoverse V2 builds on the Armv9 instruction set and incorporates SVE2 (Scalable Vector Extension 2), which enables flexible vector widths from 128 bits up to 512 bits depending on implementation choices made by silicon vendors. Typical server implementations expose 256 bit or 512 bit vector registers, providing substantial throughput improvements for data parallel workloads including cryptography, media processing, and ML inference. The core pipeline features a wider issue width than V1, allowing more instructions to be dispatched per cycle. The out of order execution window is significantly larger, enabling better instruction level parallelism and hiding memory latency more effectively. Branch prediction accuracy improvements reduce pipeline flushes, which is critical for server workloads with complex control flow like databases and web services.
Cache hierarchy enhancements are central to V2’s performance profile. Each core typically includes 64 KB of L1 data cache and 64 KB of L1 instruction cache, with per core L2 caches ranging from 512 KB to 2 MB depending on vendor integration. Multi chip module designs aggregate large last level (L3) caches that can reach tens to hundreds of megabytes, improving cache hit rates for shared data structures and reducing cross socket memory traffic. Memory interfaces support DDR5 with 4 to 8 channels in high end server configurations, delivering aggregate bandwidth exceeding 100 GB/s per socket and often reaching 200 GB/s in memory optimized SKUs. Think of it like upgrading from a two lane road to an eight lane highway for data traffic.
Key architectural features driving server performance:
Pipeline width and dispatch: Wider issue width supports higher instruction throughput per cycle, especially for independent instruction streams common in microservices and parallel processing tasks.
Out of order resources: Larger reorder buffers and reservation stations allow the core to find parallelism in longer instruction windows, improving utilization on memory bound code.
Branch predictor enhancements: More accurate prediction reduces misprediction penalties, critical for control heavy workloads like databases and request routing logic.
SVE2 vector units: Flexible vector widths (128–512 bits) accelerate SIMD friendly workloads including cryptography, compression, packet processing, and ML inference kernels.
Cache capacity increases: Larger L2 per core and expanded shared L3 reduce memory round trips, improving latency sensitive workload performance and multi threaded scaling efficiency.
DDR5 and PCIe Gen5 integration: Higher memory bandwidth and I/O throughput eliminate bottlenecks in data intensive applications, storage controllers, and accelerator attached workloads.
Expected IPC Gains and Single Thread Behavior in Neoverse V2 Servers

Measured IPC improvements over Neoverse V1 consistently fall in the 20% to 40% range across representative integer and mixed workloads, with the higher end of the range appearing in branch heavy or memory latency sensitive code that benefits most from improved prediction and out of order depth. Floating point and vectorized workloads can exceed 40% IPC uplift when SVE2 optimizations are enabled, but that requires compiler support and hand tuned libraries. Unoptimized legacy code will see gains closer to the integer baseline. These IPC gains interact with clock frequency ceilings set by process node and thermal design. Per cycle throughput is higher, but absolute frequency headroom is often similar to or slightly lower than high boost x86 SKUs, which can still reach 4+ GHz in turbo modes.
Single thread latency sensitive workloads reveal where V2 stands relative to x86. High frequency x86 cores (especially server Xeon or EPYC SKUs with aggressive turbo profiles) can maintain a 5% to 25% single thread lead in absolute performance depending on the specific application and how well it’s optimized for each architecture. The gap narrows significantly when power and thermal budgets are equalized. V2’s higher IPC at lower frequencies often delivers comparable single thread performance at substantially lower power draw. Compiler maturity is a critical variable. GCC and LLVM backends for Armv9/SVE2 have matured rapidly, but achieving the upper end of IPC gains requires appropriate compiler flags, profile guided optimization, and updated math libraries that leverage SVE2 instructions rather than falling back to older NEON paths. The difference between generic ARM builds and tuned SVE2 builds can be 15–30% in floating point throughput.
Multi Core Throughput Scaling and Server Level Performance

Neoverse V2 implementations target a broad spectrum of core counts, with typical single socket server designs ranging from 32 to 128 cores depending on vendor integration strategy and target market segment. Throughput oriented cloud workloads exhibit near linear scaling up to approximately 80–96 cores when memory bandwidth and I/O resources are provisioned appropriately. Diminishing returns appear beyond that point as synchronization overhead, cross core communication, and shared resource contention begin to dominate. For embarrassingly parallel scale out services (web servers, caching layers, containerized microservices), throughput uplift over V1 commonly ranges from 30% to 70% per socket, driven by the combination of IPC gains, higher core counts, and increased memory bandwidth from DDR5 integration.
Multi socket configurations amplify throughput potential but introduce NUMA complexity. Workloads that fail to respect NUMA topology can experience significant performance cliffs when threads access memory attached to remote sockets, with latency penalties of 50% to 150% compared to local access. Effective NUMA aware scheduling and memory placement are essential for realizing linear scaling beyond a single socket. Memory bandwidth becomes the constraining factor for many server workloads before core count saturation. High core count designs with insufficient memory channels will show poor per core utilization as threads stall waiting for data. Proper capacity planning requires measuring memory bandwidth per core for representative workloads and ensuring the socket configuration provides adequate channels and DIMM population to sustain throughput.
Factors limiting multi core scaling efficiency:
Memory bandwidth saturation: High core counts quickly exhaust available memory bandwidth when workloads are memory bound. Expect visible scaling slowdowns beyond 64–96 cores without additional memory channels.
NUMA placement and locality: Cross socket memory access adds latency. Applications must pin threads and allocate memory on the same NUMA node to avoid performance penalties exceeding 50%.
Synchronization and locking overhead: Workloads with frequent lock contention or atomic operations see sublinear scaling as core counts increase. Lock free designs or per core data structures scale better.
Shared resource contention: Last level cache capacity, interconnect bandwidth, and I/O resources are shared across cores. Poorly balanced workloads can cause hot spots that throttle overall throughput.
Benchmark Ranges: SPECint, SPECfp, and Comparable Synthetic Metrics

SPECint_rate2017 measurements on Neoverse V2 systems typically show throughput improvements of 1.2× to 1.8× over comparable core count Neoverse V1 configurations, with the range reflecting differences in core frequency, memory configuration, compiler optimization level, and firmware tuning. Single thread SPECint2017 scores track IPC gains directly, delivering 10% to 35% improvements depending on how well the workload exploits the wider pipeline and improved branch prediction. SPECfp2017 results are more variable because floating point performance depends heavily on vectorization. SVE2 optimized code paths can achieve 20% to 60% gains over V1, while scalar floating point code or workloads using older NEON intrinsics see more modest improvements closer to integer IPC ranges.
Absolute SPEC scores vary dramatically across vendor implementations due to differences in core count, sustained frequency, cache sizes, and memory channel configuration. A 64 core V2 system at 3.0 GHz with 8 DDR5 channels will post very different SPECrate scores than a 128 core system at 2.5 GHz with 4 channels, even though both are “Neoverse V2.” Procurement decisions should focus on per core scores and throughput per watt ratios rather than headline aggregate numbers. Compiler flags and library versions also introduce variance. Vendor optimized submissions using profile guided optimization and aggressive tuning can show 10% to 25% higher scores than generic builds, so independent validation with production toolchains is essential. Treat vendor benchmark claims as best case ceilings, not typical deployment results.
| Benchmark | Expected Improvement Range | Notes on Variability |
|---|---|---|
| SPECint_rate2017 | 1.2× to 1.8× vs Neoverse V1 | Depends on core count, frequency, compiler flags, and memory bandwidth; upper range requires optimized builds and high core counts. |
| SPECint2017 (single thread) | +10% to +35% vs V1 | Reflects IPC gains; higher end with branch heavy or latency sensitive workloads; frequency differences between SKUs affect absolute scores. |
| SPECfp2017 (single thread) | +20% to +60% vs V1 | Large variance driven by SVE2 vectorization; unoptimized scalar FP code sees gains closer to integer IPC range; hand tuned kernels reach upper bound. |
| SPECfp_rate2017 | 1.3× to 2.0× vs V1 | Highest gains on vectorized, memory bandwidth friendly workloads; poorly vectorized code or memory starved configs see lower improvements. |
Real World Workload Expectations: Cloud, DB, JVM, and ML Inference
Cloud native microservices and containerized web services are natural fits for Neoverse V2’s high core density and improved IPC. Measured throughput improvements over V1 typically range from 25% to 60% per socket when services are I/O bound or scale horizontally across cores. Request per second metrics improve by 15% to 40% at comparable power envelopes, and latency percentiles (P95, P99) often show 10% to 30% reductions due to better single thread efficiency and reduced context switch overhead. These gains translate directly into lower cost per request in cloud environments, with typical TCO reductions of 15% to 30% when instance pricing and power efficiency are factored together.
Database workloads show strong but workload dependent improvements. OLTP transaction throughput commonly increases by 20% to 50% over V1, with the best results appearing in read heavy or mixed workloads that benefit from higher cache capacity and IPC. Write heavy workloads with significant lock contention see smaller gains because synchronization overhead doesn’t scale with IPC. Latency sensitive queries benefit from improved single thread performance, often reducing median query time by 10% to 25% and improving tail latencies even more dramatically. OLAP and analytical queries that are memory bandwidth bound or vectorizable can see larger improvements when SVE2 optimizations are applied to aggregation and scan operators, sometimes exceeding 50% throughput gains with tuned query engines.
JVM and managed runtime workloads gain 15% to 40% in throughput after appropriate tuning. Modern JIT compilers in recent JVM releases include Armv9 and SVE2 code generation paths, but achieving peak performance requires updated JVM versions, garbage collection tuning for higher core counts, and warm up profiling to guide hotspot optimization. Startup time and cold start behavior are largely unchanged, so workloads with frequent cold starts (serverless functions, short lived containers) see smaller relative benefits than long running services with hot JIT profiles. ML inference on CPU shows the most dramatic improvements. SVE2 optimized INT8 and FP16 inference kernels deliver 1.5× to 3× higher throughput per socket compared to V1, making Neoverse V2 viable for moderate scale inference serving where GPU costs and complexity aren’t justified. HPC and vectorized floating point kernels can exceed 2× performance when recompiled with SVE2 intrinsics and appropriate math libraries, though memory bandwidth bound kernels hit scaling limits earlier.
Workload specific performance ranges:
Microservices and web servers: 25–60% higher requests per second per socket; 15–40% better perf per watt; significant TCO advantage in cloud and container dense deployments.
Databases (OLTP/mixed): 20–50% transaction throughput improvement; tail latency reductions of 15–35%; write heavy workloads see smaller gains due to locking overhead.
HPC and vectorized FP workloads: 1.5× to 2.5× throughput on SVE2 optimized kernels; memory bound workloads limited by DIMM configuration and channel count rather than core IPC.
Java/JVM workloads: 15–40% throughput uplift after JIT warm up and GC tuning; cold start and startup behavior largely unchanged; long running services benefit most.
ML inference (CPU only): 1.5× to 3× inference throughput on INT8/FP16 models with SVE2 optimization; unoptimized models see gains closer to general IPC range; GPU offload still preferred for large models.
Performance Per Watt and Thermal Expectations for Neoverse V2 Servers

Performance per watt improvements over Neoverse V1 typically range from 20% to 60% depending on workload characteristics and system configuration, with the higher end of the range appearing in throughput oriented, vectorized, or memory bandwidth limited workloads that benefit from both IPC gains and process node efficiency. Compared to contemporary x86 server processors in scale out and cloud native workloads, Neoverse V2 based systems commonly deliver 1.2× to 3× better performance per watt, with the largest advantages appearing in highly parallel, throughput focused scenarios where core density and architectural efficiency compound. Single thread, high frequency workloads show smaller perf per watt advantages because x86 turbo modes can achieve similar absolute performance at higher instantaneous power draw, narrowing the efficiency gap when only a few cores are active.
Thermal design points and socket power envelopes vary widely across vendor implementations. High core count server SKUs targeting 64 to 128 cores commonly operate in the 120 W to 300+ W range depending on binning strategy, frequency targets, and process node selection. Density optimized SKUs trade peak frequency for higher core counts and lower TDP, maximizing throughput per watt at the cost of single thread peak performance. Process node advantages play a significant role. Implementations built on 5 nm or advanced 7 nm nodes deliver better power efficiency and higher transistor density, enabling more cores or larger caches within the same thermal envelope. Rack level planning must account for total system power including memory, NICs, and accelerators, which can add 50% to 100% to socket power in high density configurations.
Key power and thermal considerations:
Perf per watt ratios: Expect 20–60% improvement vs V1 and 1.2–3× advantage vs x86 in throughput workloads; efficiency gains enable higher consolidation ratios and lower cooling costs.
TDP and socket power ranges: Typical server SKUs span 120–300+ W depending on core count and frequency; high density designs optimize for throughput per watt rather than single thread peak.
Process node impact: 5 nm and advanced 7 nm implementations deliver better efficiency and transistor density, allowing higher core counts or larger caches within thermal limits; older nodes sacrifice efficiency for cost.
Memory, Interconnect, and I/O Performance Dynamics in V2 Platforms

Memory subsystem performance is central to realizing Neoverse V2’s throughput potential, especially in high core count configurations where aggregate bandwidth demand scales linearly with active cores. Typical server implementations support 4 to 8 DDR5 memory channels per socket, delivering aggregate memory bandwidth ranging from 100 GB/s to over 200 GB/s depending on DIMM configuration, speed grades, and channel population. This represents a substantial increase over DDR4 based V1 systems and is essential for sustaining throughput on memory bound workloads like databases, caching layers, and data analytics. Memory latency characteristics also improve due to larger on chip caches and better prefetch mechanisms, reducing the penalty for cache misses and improving tail latency behavior in latency sensitive applications.
PCIe Gen5 integration in V2 platforms doubles per lane bandwidth compared to Gen4, enabling higher speed NVMe storage arrays, GPU and accelerator attachments, and multi hundred gigabit networking without I/O bottlenecks. High speed interconnects between cores and I/O devices reduce latency for interrupt handling and DMA operations, which is critical for packet processing, storage controllers, and real time telemetry workloads. NUMA topology becomes a dominant performance factor in systems with more than 64 cores or in multi socket configurations. Threads accessing memory or I/O devices attached to remote NUMA nodes experience latency penalties of 50% to 150%, which can collapse throughput for poorly tuned workloads. Effective NUMA aware thread placement and memory allocation are non negotiable for achieving advertised performance in large scale deployments.
Last level cache capacity and interconnect bandwidth between core clusters and memory controllers determine how well the system handles shared data structures and cross core communication. Multi die designs aggregate large L3 caches (often tens to hundreds of megabytes) but introduce inter die latency for cross cluster cache coherency traffic. Workloads with high cache to cache transfer rates (such as fine grained parallel tasks with frequent synchronization) are sensitive to coherency latency and may show scaling cliffs earlier than embarrassingly parallel workloads. Architects must validate memory bandwidth per core and measure cache hit rates under production load to ensure the platform configuration matches workload demands. A 128 core system with only 4 memory channels will bottleneck long before core utilization reaches 100%.
Virtualization, Containerization, and Cloud Deployment Behavior on Neoverse V2

Hypervisor and virtualization infrastructure on Arm has reached production maturity, with Linux KVM, Xen, and major cloud hypervisors supporting full virtualization, nested virtualization, and live migration on Neoverse platforms. Neoverse V2’s higher core density and improved IPC enable higher VM consolidation ratios compared to V1 and many x86 alternatives. A single 128 core V2 socket can host 2× to 3× more small VMs or containers at equivalent per VM performance compared to 64 core V1 systems, reducing per VM infrastructure cost. Virtualization overhead (CPU steal time, interrupt latency, memory ballooning) is comparable to x86 when using modern hypervisor versions, and vCPU pinning and NUMA aware VM placement deliver performance parity with bare metal for most workloads.
Container runtimes (Docker, containerd) and orchestration platforms (Kubernetes, Nomad) are fully supported on Arm with production ready images and maintained repositories for most popular software stacks. Container density and throughput per node improve significantly on V2 due to higher core counts and better single thread efficiency, making Neoverse based nodes attractive for microservice heavy environments where hundreds of small containers run per physical host. Orchestration schedulers benefit from NUMA aware placement plugins and CPU manager policies that pin containers to specific cores or NUMA nodes, preventing cross node memory access penalties. Cold start latency for containers is primarily disk and network bound rather than CPU bound, so V2’s IPC gains have minimal impact on container startup time. But sustained throughput and steady state performance improve by the same margins seen in bare metal tests, 15% to 40% depending on workload.
Deployment considerations for virtualization and containers:
Hypervisor support and maturity: KVM, Xen, and cloud hypervisors are production ready on Arm; expect feature parity with x86 for core IaaS functionality, live migration, and nested virtualization.
VM and container consolidation ratios: Higher core density and IPC enable 2–3× more VMs or containers per socket vs V1 at equivalent per instance performance; significant infrastructure cost reduction in dense deployments.
NUMA aware scheduling: Critical for performance in multi socket or high core count systems; Kubernetes CPU manager and VM placement policies must respect NUMA topology to avoid remote memory penalties.
Runtime tuning for managed workloads: JVM, .NET, and Python containers require updated runtimes and tuned garbage collection or memory allocation strategies to fully exploit higher core counts and SVE2 capabilities.
Comparing Neoverse V2 with Modern x86 Servers in Practical Deployments

Neoverse V2’s competitive positioning against contemporary Intel Xeon and AMD EPYC processors depends heavily on workload type, deployment scale, and TCO priorities. In throughput oriented, scale out environments (cloud microservices, web serving, caching, containerized applications), V2 commonly delivers 1.2× to 1.6× better performance per watt than x86 alternatives, translating into 15% to 40% lower total cost of ownership when infrastructure power, cooling, and density are factored over multi year periods. Core density advantages (64–128 cores per socket in V2 vs. typical 32–64 cores in mainstream x86 server SKUs) enable higher consolidation ratios and lower per vCPU costs, which is particularly valuable in multi tenant cloud environments and container dense deployments.
Single thread and latency critical workloads reveal where x86 retains advantages. High frequency x86 SKUs with aggressive turbo profiles (4+ GHz) can still lead Neoverse V2 by 5% to 25% in absolute single thread performance, especially in legacy applications optimized for x86 instruction sets or workflows that can’t leverage ARM’s architectural strengths. Workloads requiring mature x86 only ISV binaries, specialized database extensions, or middleware without ARM support introduce migration friction and potential compatibility costs that offset V2’s hardware efficiency gains. Hybrid deployment strategies are increasingly common. x86 remains in place for latency sensitive, single thread critical tiers, while V2 handles scale out, batch, storage, and inference workloads where throughput per watt and density matter more than raw single thread speed.
| Category | Neoverse V2 Strength | x86 Strength | Typical Outcome |
|---|---|---|---|
| Throughput per watt | 1.2–1.6× advantage in scale out workloads; lower TCO in cloud and container dense deployments | High frequency turbo modes can match V2 perf at higher power for burst workloads | V2 preferred for sustained throughput; x86 for peak single thread bursts |
| Single thread latency | Narrowed gap to 5–25% behind high clock x86; sufficient for most cloud services | High frequency SKUs still lead on absolute single thread peak; legacy code may be better optimized | x86 retains edge in latency critical or single threaded legacy apps |
| Core density and cost | 64–128 cores per socket enable higher VM/container density; 15–40% lower cost per vCPU in many scenarios | Mainstream x86 SKUs top out at 32–64 cores; premium SKUs approach V2 density at higher cost | V2 wins on consolidation and infrastructure efficiency; x86 competitive only in premium SKUs |
| Software ecosystem | Mature Linux/cloud stacks; container images widely available; compiler support strong | Decades of ISV support; proprietary binaries and middleware more common; legacy compatibility | x86 safer for closed source ISV dependencies; V2 excellent for cloud native and open source stacks |
Deployment Recommendations and Tuning Guidelines for Neoverse V2
Achieving production level performance on Neoverse V2 requires systematic tuning across compiler toolchains, runtime configurations, and system level resource management. Expect an initial engineering investment of 2 to 6 weeks per application stack to reach performance parity or superiority compared to established x86 deployments, with most effort concentrated on compiler flag optimization, NUMA aware memory allocation, and SVE2 enablement for vectorizable code paths. Metrics to track during tuning include per core IPC (target: within 5% of theoretical maximum for your workload type), 95th and 99th percentile latencies (should improve by 10–30% over V1 or baseline x86), memory bandwidth utilization per core (avoid saturation below 70% of theoretical channel bandwidth), and performance per watt ratios that validate efficiency gains.
Thread placement and NUMA topology management are critical in systems with more than 64 cores or multi socket configurations. Operating system schedulers should be configured with NUMA aware policies (numactl, taskset, or systemd CPUAffinity directives) to bind application threads and memory allocations to the same NUMA node. For latency sensitive services, consider disabling CPU frequency scaling (set governor to performance mode) and isolating cores using kernel boot parameters (isolcpus) to prevent scheduler interference. Hugepage configuration significantly improves TLB hit rates and reduces memory management overhead. Allocate transparent hugepages or static hugepages for large memory footprints, especially in databases, in memory caches, and ML inference engines. Compiler optimization for SVE2 requires explicit flags (e.g., march=armv9 a+sve2 in GCC/LLVM) and updated math libraries (OpenBLAS, oneDNN, or vendor optimized BLAS) to unlock vectorized floating point and integer throughput. Unoptimized builds will leave 20% to 50% of performance on the table.
Practical tuning checklist:
Compiler and build flags: Use march=armv9 a+sve2 and profile guided optimization; link against SVE2 optimized math libraries (BLAS, FFT, crypto); rebuild dependencies to avoid falling back to generic ARM or NEON code paths.
NUMA and memory locality: Pin application threads and allocate memory on the same NUMA node using numactl or cgroup cpusets; validate placement with numastat and perf to confirm local memory access dominates.
Memory tuning: Enable hugepages (transparent or static) for large memory workloads; tune THP settings to balance fragmentation risk; monitor TLB miss rates with perf to confirm THP effectiveness.
Thread pool and concurrency configuration: Match worker thread counts to physical core counts (avoid over subscription); disable SMT/hyper threading equivalents if present; tune queue depths and batch sizes to match cache and memory bandwidth.
Runtime and GC tuning for managed workloads: Update JVM, .NET runtime, or Python interpreter to versions with Armv9/SVE2 support; tune GC parameters for higher core counts (e.g., G1GC or ZGC thread counts, heap sizing); profile warm up behavior to ensure JIT generates optimized ARM code.
Final Words
Neoverse V2 delivers a tangible step up: 20–40% IPC gains versus V1, SPECint/ SPECfp improvements in the 20–60% range when code is vectorized, and narrower single-thread gaps with x86. Those numbers set realistic server performance expectations.
Expect 20–60% throughput boosts in cloud, DB, microservices, and ML inference, plus notable perf-per-watt wins. Multi-core scaling is strong but benefits from NUMA and compiler tuning.
ARM Neoverse V2 server performance expectations explained here point to faster, more efficient scale-out choices—worth validating on your workloads.
FAQ
Q: What IPC uplift does Neoverse V2 provide compared to V1?
A: The Neoverse V2 provides a 20–40% IPC uplift versus V1, narrowing single-thread gaps with x86 to roughly 5–25% depending on SKU, clock ceilings, and workload characteristics.
Q: What SPECint and SPECfp improvements can I expect from Neoverse V2?
A: The Neoverse V2 shows SPECint_rate commonly in the 1.2–1.8× range versus V1 and SPECfp gains of about 20–60% when SVE2 vectorization is applied; results vary with cores, clocks, and compilers.
Q: How do real-world workloads perform on Neoverse V2 (cloud, DB, microservices, ML inference)?
A: The Neoverse V2 delivers 20–60% throughput gains for cloud, microservices, and databases, and 1.5–3× for ML inference when SVE2-optimized, with perf-per-watt improvements typically of 15–40%.
Q: How does Neoverse V2 single-thread behavior compare to modern x86 processors?
A: The Neoverse V2 narrows single-thread gaps to roughly 5–25% behind modern x86; IPC gains, better branch prediction, and vector pipelines reduce real-app differences, though x86 peak frequencies can still win some cases.
Q: How well does Neoverse V2 scale across many cores and sockets?
A: The Neoverse V2 scales near-linearly up to about 80–96 cores for cloud workloads; socket counts commonly range 32–128 cores, but NUMA tuning and memory bandwidth limits matter beyond roughly 64 cores.
Q: What perf-per-watt and thermal expectations should I plan for with Neoverse V2?
A: The Neoverse V2 typically improves perf-per-watt by 20–60% versus V1 and often shows 1.2–3× perf/W advantage over x86 in throughput workloads; TDP commonly spans about 80–300+ W depending on process and configuration.
Q: How important are memory, interconnect, and I/O on V2 platforms?
A: Memory and I/O are critical on Neoverse V2: DDR5 with 4–8 channels can deliver 100–200+ GB/s, PCIe Gen5 supplies high I/O bandwidth, and NUMA locality significantly affects performance past ~64 cores.
Q: Is Neoverse V2 ready for virtualization, containers, and cloud deployments?
A: Neoverse V2 is production-ready for virtualization and container use, with mature Linux/KVM/Xen support and optimized runtimes; expect higher consolidation ratios and better microservice throughput, but plan orchestration tuning.
Q: How does Neoverse V2 compare to x86 in practical deployments and TCO?
A: Neoverse V2 often yields 15–40% lower TCO in many cloud scenarios and 1.2–1.6× perf/W versus x86; x86 still leads in high-frequency single-thread peaks while V2 excels at scale-out efficiency.
Q: What tuning steps deliver the biggest performance gains on Neoverse V2?
A: The key tuning steps are enabling SVE2/vectorization, applying compiler optimizations, enforcing NUMA placement, tuning memory parameters, and adjusting thread‑pool settings; expect 2–6 weeks of validation for best results.
Q: Which microarchitectural features drive Neoverse V2’s performance improvements?
A: Neoverse V2 combines Armv9 with SVE2, wider issue width, larger out-of-order windows, improved branch prediction, 64 KB L1, 512 KB–2 MB L2 per core, and larger L3 caches to boost throughput and vector workloads.