

Is choosing the nearest cloud region the safe, default move everyone assumes?
When a hyperscaler opens a new region, differences in latency, pricing, feature set, compliance, and migration complexity can reshape your architecture and costs.
This post gives a practical, multi‑factor framework to compare new‑region launch impacts—combining real measurements (latency, bandwidth, pricing) with policy checks (data residency, certifications) and migration cost estimates.
Read on to learn a repeatable way to pick regions that fit your apps and avoid costly migration mistakes.
Framework for Evaluating Cloud Provider New‑Region Launch Impacts

When a hyperscaler announces a new region, you’re looking at a decision that goes way beyond pin‑dropping a dot on a map. Comparing new‑region launch impacts means you’ve got to map performance, cost, service parity, compliance, migration complexity, and disaster recovery constraints against what you’re already running. A lot of organizations just default to whatever the provider recommends or pick the closest geography. They end up missing real differences in pricing, latency, feature availability, and regulatory fit. A structured, multi‑factor evaluation keeps you from burning money on migrations into regions that can’t deliver what your business actually needs.
You need metrics. Latency from representative user locations to the new region. Bandwidth capacity and ISP peering quality. Service and instance‑type availability at launch. Data residency and regulatory certification status. Pricing variance across compute, storage, and egress. Measured latency deltas can swing 2–3× depending on where the region actually sits. Testing from the same platform showed roughly 80 ms to the US East Coast versus 200–300 ms to India. Service rollout cadence varies too. Regions like us‑east‑1 and eu‑west‑1 historically get new AWS services first. Newly launched regions? They might wait months for full parity. Pricing differences compound over time. AWS standard egress costs range from 0.05 to 0.09 dollars per GB depending on region and volume, and regional compute pricing can vary by double‑digit percentages for the same instance family.
Your evaluation needs to combine quantitative benchmarks (latency tests, bandwidth probes, TCO calculators) with qualitative constraints like GDPR, LGPD, PDPA, HIPAA, or PCI DSS compliance requirements and migration runway estimates. Quantitative data alone misses regulatory blockers. Qualitative assessment alone ignores cost and performance trade‑offs. The goal is a decision matrix that ranks candidate regions on weighted criteria, backed by real measurements and cost projections.
Key decision criteria to measure for any new‑region launch:
- End‑to‑end latency and bandwidth from representative client locations and on‑premises sources to the new region.
- Service and instance‑type availability at launch and projected rollout timeline for missing features.
- Regulatory certification status and data residency constraints for the new region.
- Regional pricing differences for compute, storage, outbound data transfer, and managed services, adjusted for commitment discounts.
- Migration and replication costs, including one‑time transfer fees, ongoing cross‑region replication bandwidth, and cutover complexity.
- High‑availability and disaster recovery suitability, including availability zone count, inter‑AZ latency, and geographic fault‑tolerance when paired with existing regions.
Latency and Performance Impact Analysis for New Cloud Regions

Latency testing for a new region means measuring round‑trip time from representative user locations, on‑premises data sources, and existing cloud deployments. Synthetic tests using ICMP ping, TCP handshake timers, and HTTP request benchmarks establish baseline latency. Real user monitoring captures variation under production traffic patterns and ISP routing. Run tests at multiple times of day and across multiple ISPs to account for peering quality and route flapping. Baseline latency budgets should match application requirements. Real‑time financial analytics might target sub‑10‑millisecond inter‑service latency. Batch processing can tolerate hundreds of milliseconds.
ISP peering and regional network architecture materially affect real‑world performance. Providers use private fiber networks. GCP operates a private subsea fiber network routing traffic away from the public internet to stabilize latency and reduce jitter. Regions with strong ISP peering and co‑location hubs (large metropolitan areas, financial centers) often deliver lower and more consistent latency than geographically closer regions with weaker peering. Validate peering quality using traceroute, MTR (My Traceroute), and provider‑specific tools such as AWS Reachability Analyzer or GCP Network Intelligence Center.
Test steps for latency and bandwidth assessment:
- Deploy minimal test workloads (small compute instances, object storage buckets) in the new region and existing regions for side‑by‑side comparison.
- Measure round‑trip latency from client locations using ping, curl timing, and application‑layer requests (HTTPS GET with timing headers).
- Test bandwidth capacity by transferring representative file sizes and measuring throughput, packet loss, and jitter.
- Validate inter‑service latency for distributed architectures by deploying test microservices across availability zones and measuring service‑to‑service request time.
- Run tests during peak traffic hours and from multiple ISPs to capture worst‑case performance and routing variance.
Regional Pricing, Data Transfer Costs, and TCO Comparison Factors
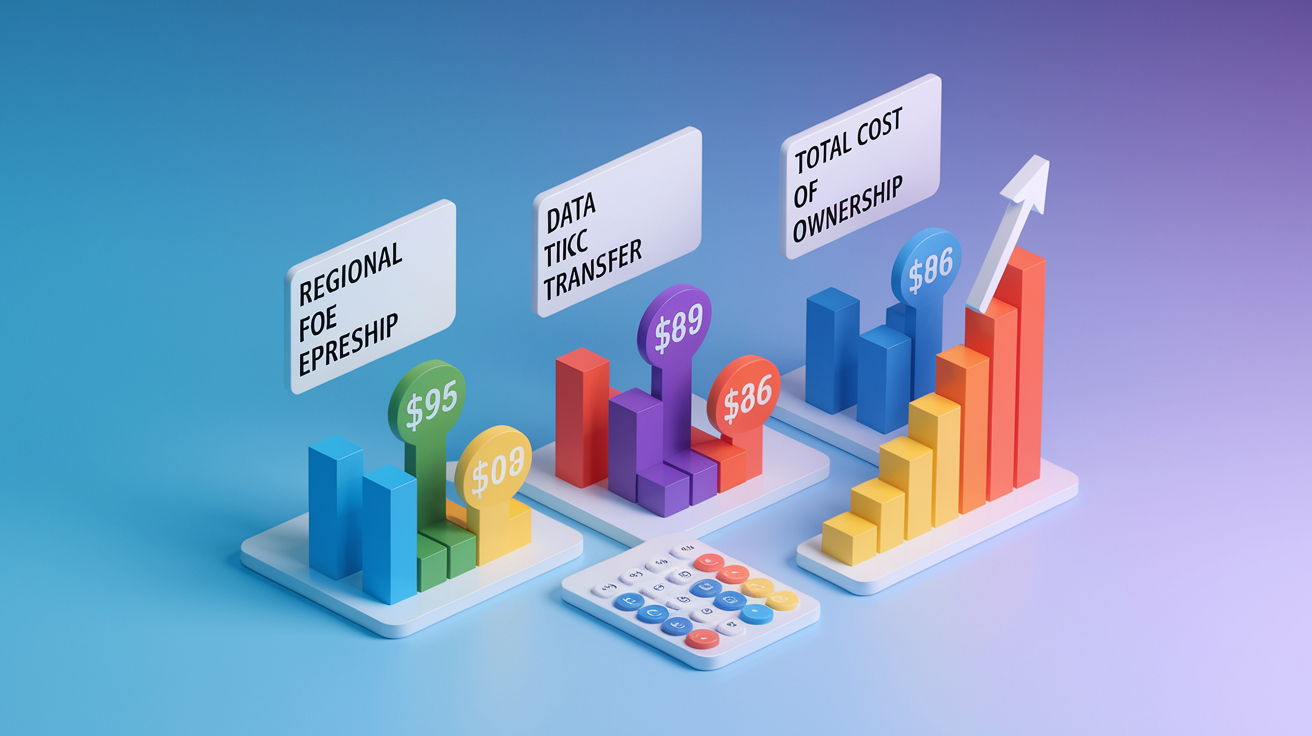
Regional pricing variance affects every layer of the stack. Compute instance pricing for identical instance types can differ by 10–20 percent across regions. Storage pricing shows similar variation. Data transfer costs compound over time and vary by direction. Egress from regions to the internet ranges from 0.05 to 0.09 dollars per GB on AWS depending on volume tier and region. Azure and AWS include 100 GB of free monthly outbound transfer. Cross‑region replication adds recurring bandwidth charges. AWS DataSync, Database Migration Service, and S3 Cross‑Region Replication all bill for data moved. TCO modeling must capture compute hours by instance type, storage in terabytes, monthly outbound gigabytes, cross‑region replication volume, and discount effects from commitment programs.
Commitment discounts reduce on‑demand pricing but require upfront analysis. AWS Savings Plans offer up to 72 percent discounts for one‑ or three‑year commitments. Azure Hybrid Benefit lets you repurpose Windows and SQL Server licenses to cut VM costs by up to 80 percent. GCP Committed Use Discounts provide up to 70 percent savings using a flexible spend‑based model. These discounts apply per region, so migrating to a new region can reset discount utilization unless the commitment model supports global or transferable credits. Migration costs include one‑time fees for data transfer. AWS Snowball and Snowmobile handle physical shipment for very large datasets to avoid prohibitive bandwidth costs. You’ve also got ongoing replication expenses for continuous synchronization.
TCO comparison must also include expected outage cost. A single major outage in a real‑time financial analytics platform can cost millions of dollars in lost trades and reputation damage. The TCO formula should incorporate expected annual downtime hours multiplied by outage cost per hour. This expected outage cost often justifies spending more on regions with stronger SLAs, more availability zones, and proven failover capabilities.
| Cost Factor | Description | Region‑Dependent? |
|---|---|---|
| Compute instance pricing | Hourly rate for VMs, containers, serverless executions by instance family and size | Yes – can vary 10–20% |
| Storage (block, object, archival) | Per‑GB‑month cost for persistent disks, object buckets, and long‑term archival tiers | Yes – regional variance up to 15% |
| Outbound data transfer (egress) | Per‑GB cost for data leaving the region to internet or other regions | Yes – 0.05–0.09 USD/GB on AWS; varies by destination |
| Cross‑region replication bandwidth | Monthly GB transferred for HA/DR synchronization, backups, or multi‑region state | Yes – charged per source/destination pair |
| One‑time migration costs | Snowball/Snowmobile shipment fees, DMS/DataSync transfer charges, snapshot copy fees | Partially – shipment and transfer pricing vary by region |
For a detailed comparison of hyperscaler pricing structures and discount programs, see Comparing AWS, Azure, and GCP, which illustrates how Azure Hybrid Benefit, AWS Savings Plans, and GCP Committed Use Discounts apply across different regional pricing tiers.
Comparing Service Availability and Feature Parity in Newly Launched Regions

Early‑stage regions often lack full instance families, managed database engines, or specialized services. A new region might launch with general‑purpose compute instances and object storage but delay GPU instances, high‑memory families, or managed Kubernetes offerings for months. Some regions receive services months earlier. Historically, us‑east‑1 and eu‑west‑1 on AWS receive new features first. Newer or smaller regions wait for global rollout. Verification of service availability is critical before committing to migration. Confirm presence of required services such as AWS Lambda, Amazon Redshift, Amazon Kinesis, managed databases (RDS, Aurora), and S3 Cross‑Region Replication.
Check provider service availability pages and region‑specific documentation for current and planned feature support. Providers publish roadmaps and feature availability matrices, but these are often incomplete or outdated. Deploy test workloads and attempt to provision required services in the new region. Failed provisioning or missing API endpoints reveal gaps not documented in marketing materials. Track general availability (GA) versus preview status. Preview services might have limited SLAs, restricted throughput, or incomplete API parity.
How to Build a Regional Service Availability Matrix
Construct a matrix listing critical services and instance types in rows and candidate regions in columns, then populate cells with availability status, launch date, and SLA tier:
- List every service, instance family, and managed feature your architecture depends on (compute, storage, databases, serverless, networking, AI/ML accelerators).
- For each region, query the provider console or API to confirm the service is available, noting GA versus preview status and any regional quota limits.
- Record the date the service became available in each region to estimate rollout lag for future features.
- Flag any missing services or instance types as blockers. Estimate the business impact if those features remain unavailable during your planned migration window.
Compliance, Data Residency, and Legal Considerations for New Regions

Data sovereignty and regulatory certification requirements can mandate or exclude specific regions. GDPR restricts certain data processing to EU regions. LGPD applies to data originating in Brazil. PDPA governs Singapore. HIPAA and PCI DSS impose strict controls on US healthcare and payment data. Providers differ in regional certification. Azure offers Sovereign Cloud variants for government and regulated industries. AWS and GCP vary certification per region, with newer regions often lacking HIPAA or PCI attestations at launch. Verify that the new region holds required certifications before migrating regulated workloads.
Data residency constraints require technical and contractual controls. Design “Local DataLock” architectures that prevent data from leaving required jurisdictions. Use regional firewalls, cross‑region replication blockers, and configuration auditing to enforce residency. Some regulations also dictate legal jurisdiction for data requests and law enforcement access. A region operated under a different national legal framework can expose data to foreign government requests. Map each region to its legal jurisdiction and assess exposure under local surveillance and data‑request laws.
Compliance checklist for evaluating new‑region launches:
- Identify applicable regulations for each data type and workload (GDPR, LGPD, PDPA, HIPAA, SOC 2, PCI DSS, FedRAMP).
- Verify regional certifications on provider compliance pages and third‑party attestation reports. Confirm certifications are current and cover required controls.
- Map data residency requirements to region geography. Ensure no automated replication or backup processes move data outside permitted jurisdictions.
- Review legal jurisdiction and data‑request procedures for the region. Assess risk of foreign government access under local laws.
- Audit configuration and replication policies to confirm technical enforcement of residency and compliance controls. Use tools like AWS Config, Azure Policy, or GCP Security Command Center.
HA/DR Architecture and Multi‑Region Topology Impacts

New‑region launches change disaster recovery strategies and multi‑region failover patterns. High availability within a region relies on availability zones (isolated data centers within the same geographic area). All production regions should offer at least two availability zones. Some offer three or more. Disaster recovery across regions requires selecting a secondary region that balances geographic distance for fault isolation with replication latency for fast failover. Example region pairings include us‑east‑1 (N. Virginia) with us‑west‑2 (Oregon), eu‑west‑1 (Ireland) with eu‑central‑1 (Frankfurt), and ap‑northeast‑1 (Tokyo) with ap‑southeast‑1 (Singapore).
RTO (Recovery Time Objective) and RPO (Recovery Point Objective) targets depend on replication latency and region distance. Synchronous replication across regions introduces high latency, typically impractical beyond a few hundred kilometers. Most cross‑region DR uses asynchronous replication, accepting some data loss (higher RPO) in exchange for lower latency overhead. Azure Region Pairs are spaced at least 300 miles apart to ensure fault isolation during large‑scale failures. Some regions show higher inter‑AZ latency due to physical distance or network topology, affecting high‑frequency, low‑latency workloads that distribute state across zones.
Testing failover is critical. Use Route 53 multi‑region failover, Azure Traffic Manager, or GCP Global Load Balancing to automate DNS‑based failover. Validate that failover completes within RTO targets and that applications function correctly in the secondary region. Run regular DR drills to measure actual failover time, data loss, and application behavior under failure conditions.
| Region Pair | Replication Latency (approx.) | AZ Count | DR Suitability |
|---|---|---|---|
| us‑east‑1 ↔ us‑west‑2 | 60–80 ms | 6 / 4 | High – proven pairing, sufficient distance |
| eu‑west‑1 ↔ eu‑central‑1 | 20–30 ms | 3 / 3 | High – low latency, GDPR‑compliant |
| ap‑northeast‑1 ↔ ap‑southeast‑1 | 70–90 ms | 4 / 3 | Medium – good distance, moderate latency |
| us‑east‑1 ↔ eu‑west‑1 | 80–100 ms | 6 / 3 | Low – cross‑continent adds complexity, higher latency |
Migration, Replication Costs, and Cutover Complexity When Adopting New Regions
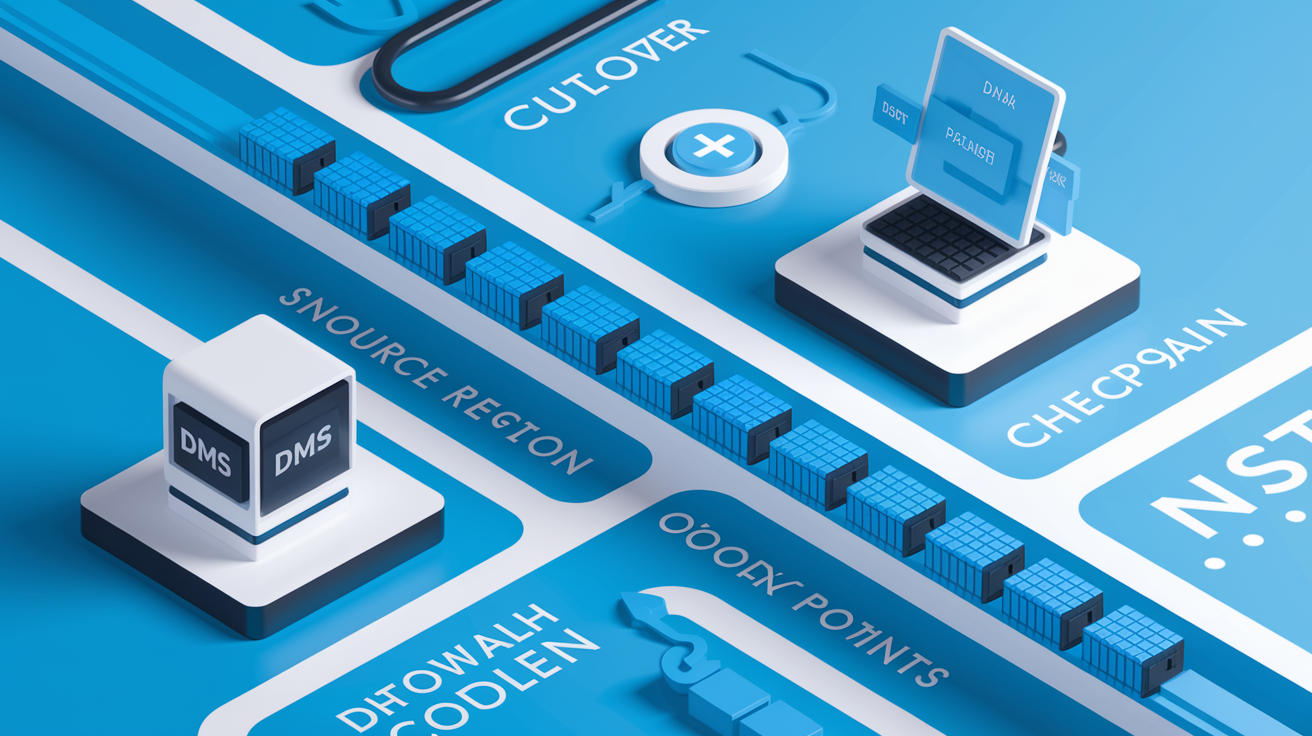
Migration to a new region requires estimating one‑time transfer costs, ongoing replication bandwidth, and cutover complexity. For very large datasets (multi‑terabyte or petabyte‑scale), physical shipment using AWS Snowball or Snowmobile avoids prohibitive bandwidth costs. A Snowball Edge device holds up to 80 TB and costs a fraction of transferring the same data over the internet. For smaller datasets or continuous replication, use AWS Database Migration Service (DMS), AWS DataSync, or EBS snapshot copy for incremental transfers. Continuous replication adds monthly bandwidth costs. Snapshot‑based replication reduces cost by transferring only changed blocks.
Brownfield migrations face additional constraints. Applications with hardcoded region references, region‑specific IAM policies, or cross‑region dependencies require code and configuration changes. Database migrations require schema validation, replication lag monitoring, and cutover windows to minimize downtime. Multi‑tier applications might need phased migration (move static assets and caches first, then application servers, then databases) with rollback procedures at each stage.
Migration evaluation checklist:
- Estimate total data volume across compute instances, block storage, object storage, databases, and backups. Determine whether physical shipment is cost‑effective.
- Calculate one‑time transfer costs using provider pricing calculators. Include Snowball/Snowmobile fees, bandwidth charges for online transfer, and snapshot copy costs.
- Model ongoing replication costs for HA/DR, backups, or multi‑region state synchronization. Multiply monthly GB transferred by regional egress pricing.
- Identify application dependencies on region‑specific resources, endpoints, or configurations. Plan code and IAM policy updates.
- Design cutover and rollback procedures for each migration phase. Test rollback to confirm the ability to revert if the new region underperforms or encounters issues.
Network Connectivity and Interconnect Evaluation for New Regions

Network connectivity options differ by region and affect latency, bandwidth, and cost. AWS Direct Connect, Azure ExpressRoute, and GCP Interconnect provide private, high‑speed links between on‑premises infrastructure and cloud regions, bypassing the public internet to reduce latency and improve security. Not all regions support Direct Connect or ExpressRoute at launch. Verify interconnect availability and local co‑location partners before committing to a new region. GCP Global VPC architecture allows resources in different regions to communicate over private IP space without performance overhead, simplifying multi‑region networking.
ISP peering quality varies by region. Large metropolitan hubs (New York, London, Tokyo, Singapore) typically have strong ISP peering and co‑location facilities, delivering lower latency and higher bandwidth. Smaller or newly launched regions might rely on fewer peering connections, increasing latency and reducing redundancy. Use traceroute and MTR to map the network path from representative locations to the new region. Count hops, identify high‑latency segments, and check for asymmetric routing that increases round‑trip time.
Routing and BGP configuration also matter for multi‑region architectures. Some providers allow custom BGP advertisements and route preferences. Others restrict routing control. If your architecture relies on anycast, traffic steering, or multi‑region failover at the network layer, confirm that the new region supports required routing features. Test failover by simulating region unavailability and verifying that traffic reroutes correctly without manual intervention.
Competitive Landscape and Provider‑Specific Regional Strength Comparison

Provider regional footprints differ in scale and geographic coverage. AWS operates 39 regions and 123 availability zones as of Q4 2025, with broad global reach and the largest service catalog. Azure maintains over 70 regions across 35 countries, offering the industry’s largest geographic footprint and specialized compliance through Azure Government and Sovereign Clouds. GCP operates 49 regions and 148 zones with the fastest growth among hyperscalers, emphasizing private fiber networking and strong performance in Asia‑Pacific markets.
Support tier structures and local account teams vary by provider and region. GCP support pricing ranges from 3 to 10 percent of monthly cloud spend based on tier selection. AWS Business Support uses a percentage‑based model that scales with spend. Azure Standard support costs 100 dollars per month with 24/7 access and one‑hour response for critical incidents. Some providers offer region‑specific account teams and local‑language support. Others centralize support regardless of region. Evaluate support availability, response‑time SLAs, and escalation procedures for the new region, especially if operating in non‑English‑speaking markets.
Regional strengths to compare when providers launch new locations:
- Service breadth and rollout cadence – AWS us‑east‑1 and Azure West US historically receive new services first. GCP emphasizes simultaneous multi‑region launches for core services.
- Interconnect and peering partnerships – strong local ISP and co‑location partnerships improve latency and bandwidth. Verify Direct Connect, ExpressRoute, or Interconnect availability.
- Marketplace and ISV readiness – some regions lag in third‑party software availability, managed service integrations, or certified partner solutions.
- Local support and account presence – regional account teams and local‑language documentation improve operational efficiency and issue resolution speed.
Weighted Scoring, Matrices, and Decision Models for New‑Region Evaluation

Decision matrices quantify trade‑offs across competing criteria. Construct a weighted scoring matrix by listing evaluation criteria in rows, assigning normalized weights that sum to 100, and scoring each candidate region on a 0–10 scale for each criterion. Multiply scores by weights, sum weighted totals, and rank regions. Example weight allocation for latency‑sensitive financial workloads: latency 30, compliance 20, service availability 15, cost 15, HA/DR 10, migration effort 10. Adjust weights to match business priorities. Compliance‑heavy industries increase regulatory weighting. Cost‑sensitive startups increase pricing weight.
TCO modeling inputs include compute hours by instance type, storage in terabytes, monthly outbound gigabytes, cross‑region replication volume, commitment discount percentages, one‑time migration costs, and expected outage cost multiplied by annual downtime risk. Use provider pricing calculators to generate 12‑month and 36‑month cost projections for each region, adjusting for reserved instances, savings plans, and hybrid‑use discounts. For checklists and structured evaluation templates, reference How to Choose a Region for Your Cloud Platform, which provides scoring inputs and threshold examples.
The matrix should also capture non‑quantifiable constraints. Regulatory blockers, vendor lock‑in risks, and strategic alignment with corporate geographic expansion plans don’t fit numeric scoring but can override cost and performance metrics. Flag these constraints as binary pass/fail gates applied before weighted scoring.
How to Create a Weighted Region Comparison Matrix
Start by defining criteria columns: criterion name, assigned weight, scoring method, and threshold for acceptable performance. Normalize weights to sum to 100, ensuring the most critical business drivers receive the highest allocations. Score each region on a consistent 0–10 scale, using measured data (latency tests, pricing calculations) for quantitative criteria and expert judgment for qualitative factors (migration complexity, vendor relationship strength). Multiply each score by its weight, sum weighted scores per region, and rank regions from highest to lowest total.
| Criterion | Weight | Scoring Method | Example Threshold |
|---|---|---|---|
| Latency to end users | 30 | Measured round‑trip time in ms; lower is better | 10 = <50 ms; 5 = 50–100 ms; 0 = >200 ms |
| Compliance certification | 20 | Binary pass/fail for required certs (GDPR, HIPAA); partial for missing attestations | 10 = all required certs; 0 = missing critical cert |
| Service availability | 15 | Percentage of required services available at launch | 10 = 100% available; 5 = 75%; 0 = <50% |
| 36‑month TCO | 15 | Calculated total cost including compute, storage, egress, replication, migration | 10 = lowest TCO; scale linearly to 0 = highest |
| Migration effort | 10 | Estimated person‑days and complexity (low/medium/high) | 10 = <30 days, low complexity; 0 = >90 days, high |
Final Words
In the action, we walked through a practical framework: latency benchmarking, service-availability audits, pricing/TCO comparison, compliance checks, HA/DR planning, migration cost modeling, and connectivity evaluation.
Run both quantitative tests (latency, bandwidth, TCO) and qualitative checks (regulatory fit, feature parity), then score options with a weighted matrix to prioritize what matters for your workloads.
Use the checklist and scoring approach so you can answer how to compare cloud provider new-region launch impacts for your stack — and move forward with less risk and clearer costs.
FAQ
Q: What is the best framework for evaluating a cloud provider’s new-region launch?
A: The best framework for evaluating a cloud provider’s new-region launch uses multi-factor analysis — latency, bandwidth, service parity, compliance, migration effort, TCO, and HA/DR suitability to score readiness and risk.
Q: How should I benchmark latency and performance for a new region?
A: To benchmark latency and performance for a new region, run synthetic tests from target locations, compare real-user monitoring baselines, measure bandwidth, jitter, packet loss, and repeat tests across ISPs and time windows.
Q: What pricing and TCO factors must I compare across regions?
A: Key pricing and TCO factors to compare include compute hours, storage TB, outbound egress per GB, cross-region replication GB, migration tool costs, and commitment discounts that significantly alter long-term spend.
Q: How do I verify service availability and feature parity in new regions?
A: To verify service availability and feature parity, build a matrix listing instance types, managed services, GA versus preview status, region-specific limitations, and automate API or console checks for critical services before migration.
Q: What compliance and data residency checks are needed for new regions?
A: Compliance and data residency checks require mapping local laws (GDPR, LGPD, PDPA, HIPAA), verifying region certifications, confirming data access procedures, encryption controls, and contract clauses for legal requests and residency guarantees.
Q: How do new regions affect HA/DR architecture and RTO/RPO planning?
A: New regions affect HA/DR by changing replication latency, region pairing options, AZ topology, and therefore RTO/RPO targets; update replication tests, failover drills, and cost estimates for cross-region recovery.
Q: What migration, replication costs, and cutover complexities should I expect?
A: Migration and cutover costs include one-time data transfer (Snowball/Snowmobile), ongoing replication GB/month, snapshot strategies to lower transfer, tool licensing (DMS/DataSync), and effort for rollback and validation.
Q: How should I evaluate network connectivity and interconnect options for a new region?
A: Evaluating connectivity means testing provider private links (Direct Connect/ExpressRoute), peering and ISP quality, BGP routing behavior, redundancy options, and measuring latency and packet loss from your on‑prem networks.
Q: How do provider regional strengths differ and which should I prefer?
A: Provider regional strengths differ by service rollout cadence, feature parity, local support tiers, and partner ecosystems; prefer the provider that matches your required services, support level, and geographic compliance needs.
Q: How do I build a weighted scoring model to choose between regions?
A: To build a weighted scoring model, list criteria (latency, compliance, availability, cost, HA/DR, migration effort), assign weights summing to 100, normalize scores, and run sensitivity to key weight changes.