


What if your security team could safely ignore most cloud alerts and still stop real threats?
Companies running AWS, Azure, GCP, or OCI can see millions of alerts a day, and that flood breeds fatigue and missed incidents.
This post lays out practical cloud security alert prioritization strategies that reduce fatigue and speed response.
You’ll get a compact framework—centralize telemetry, ask risk-driven triage questions, enrich alerts with context, automate routine fixes, tune detections, and fix root causes—so analysts see fewer, higher-value alerts.
Core Principles for Effective Cloud Alert Prioritization

Cloud teams drown in security alerts. A single company running AWS, Azure, GCP, and OCI can see millions of alerts each day from misconfigurations, policy violations, weird API activity, runtime anomalies. Without structure, you get alert fatigue. Analysts see so many repetitive notifications that they start missing the real threats or responding slower. The outcome? Longer incident response times, compliance holes, and higher breach risk in places where attackers don’t waste time.
Good cloud security alert prioritization starts with a triage process built around high-value questions you can ask every time. Is sensitive data exposed? Are privileges escalating across multiple locations? Are API calls spiking from IPs or regions you don’t recognize? These questions form the skeleton of a framework that routes alerts by severity: Critical (act now), Warning (investigate within your SLA), Informational (monitor or suppress). Each tier maps to specific workflows, escalation paths, and service-level agreements so analysts know exactly what to do.
The best models blend automation and human judgment. They pull monitoring data from all cloud providers into one place to stop context switching. They enrich every alert with asset details and telemetry. They automate low-risk fixes. They tune detection rules using backtesting and beta workflows. They push alert trends into long-term architectural fixes. This cuts noise, speeds up triage, and makes sure the alerts that reach your analysts are worth the time.
Six principles anchor every strong cloud alert prioritization strategy:
Centralize monitoring. Pull cloud telemetry from every provider into one interface so analysts can connect alerts across regions and services without jumping between consoles.
Structured triage. Build a repeatable checklist of risk questions. Map each answer to a severity tier, escalation path, and SLA so every alert gets evaluated the same way.
Enrich alerts with context. Automatically attach instance metadata, IAM activity, CPU and network trends, deployment history, threat intelligence. This reduces investigation time and improves scoring.
Automate remediation. Offload common low and medium-risk responses like account suspension, firewall correction, traffic blocking to automated playbooks. Save human review for high-impact decisions.
Tune detection rules continuously. Use backtesting on historical data and beta testing in live environments to validate rules, adjust thresholds, add exceptions, refine query logic before full deployment.
Plan for the long term. Look at alert trends to spot recurring misconfigurations, refine IAM policies, harden golden images, define secure cloud landing zones that prevent alerts before they start.
Risk-Driven Prioritization Models for Cloud Security Alerts
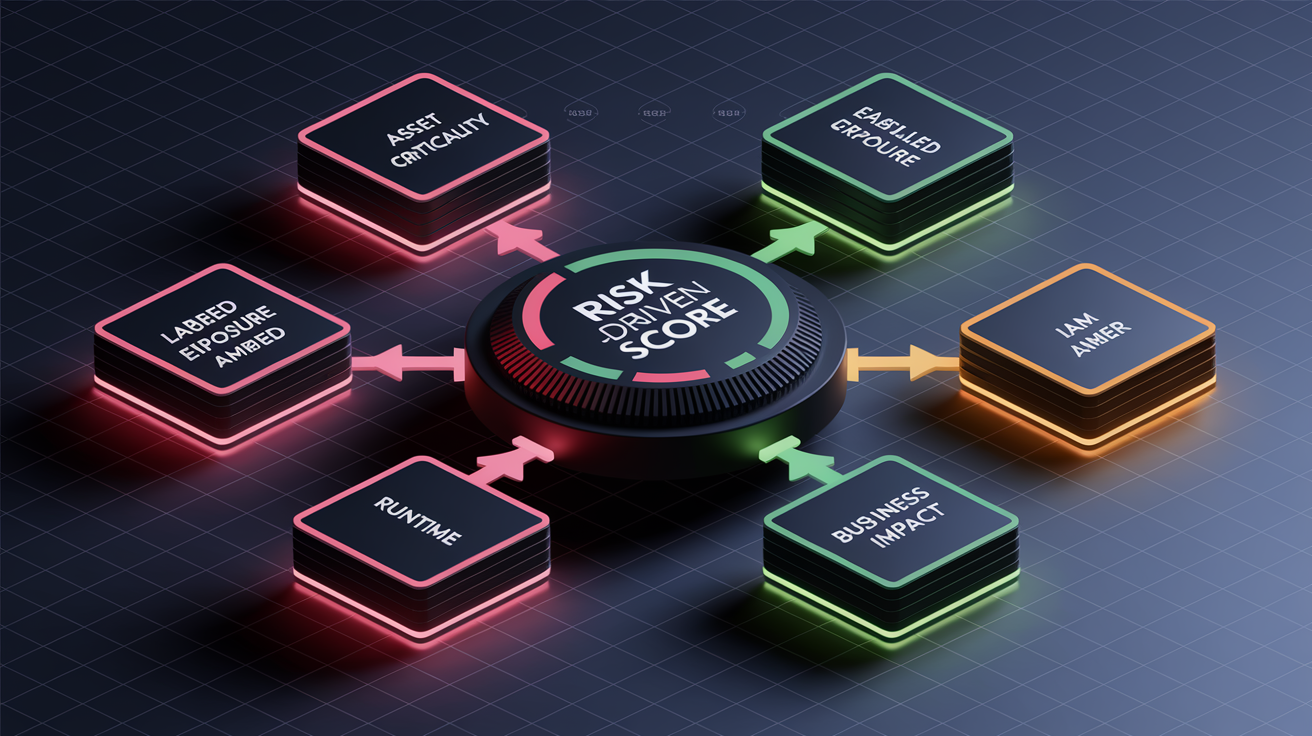
A flat severity score can’t capture cloud security risk. You need a two-tier model. First, rank alerts by product area or control domain: identity, network exposure, data sensitivity, workload integrity. Second, rank individual resources within each domain by their actual risk exposure. This makes sure high-impact control failures surface fast while lower-risk alerts queue appropriately. Risk scoring has to be dynamic. It pulls in real-time signals like asset criticality, exploitability evidence, IAM exposure patterns, runtime telemetry (CPU, memory, network flows, recent deployments), and business impact. A vulnerability in a package running in production with access to customer data? That scores way higher than the same CVE in a dormant dev environment.
Context is how you separate noise from signal. Asset criticality reflects the business value and data sensitivity of the resource. IAM exposure measures whether the compromised identity has broad permissions, recent privilege escalations, or access to sensitive APIs. Runtime evidence like unexpected CPU spikes, outbound connections to unknown IPs, or recent configuration changes tells you whether an attack is actively progressing. Exploitability data (public exploits, CVSS temporal scores, vendor advisories) clarifies whether a vulnerability is theoretical or weaponized. Business impact considers regulatory obligations, customer-facing services, financial exposure. Together these factors produce a composite risk score that guides prioritization and automates triage routing.
| Factor | Description | Impact on Prioritization |
|---|---|---|
| Asset Criticality | Business value, data sensitivity, customer-facing status, compliance scope of the resource | Elevates alerts on production workloads, databases with PII, revenue-critical services |
| Exploitability | Existence of public exploits, CVSS score, vendor advisories, active exploitation in the wild | Pushes alerts on exploitable vulnerabilities to the front of the queue |
| IAM Exposure | Granted permissions, recent privilege changes, credential hygiene (MFA status, access key age) | Flags identities with high blast radius or missing hardening controls |
| Runtime Evidence | CPU and memory anomalies, unexpected network connections, recent deployments, IAM actions | Identifies active attacks vs. dormant misconfigurations, reducing false positives |
| Business Impact | Regulatory risk (HIPAA, SOC 2), customer SLAs, revenue impact, reputation risk | Ensures compliance-critical and customer-facing alerts are handled within strict SLAs |
Automated Prioritization and SOAR Workflows for Cloud Alerts
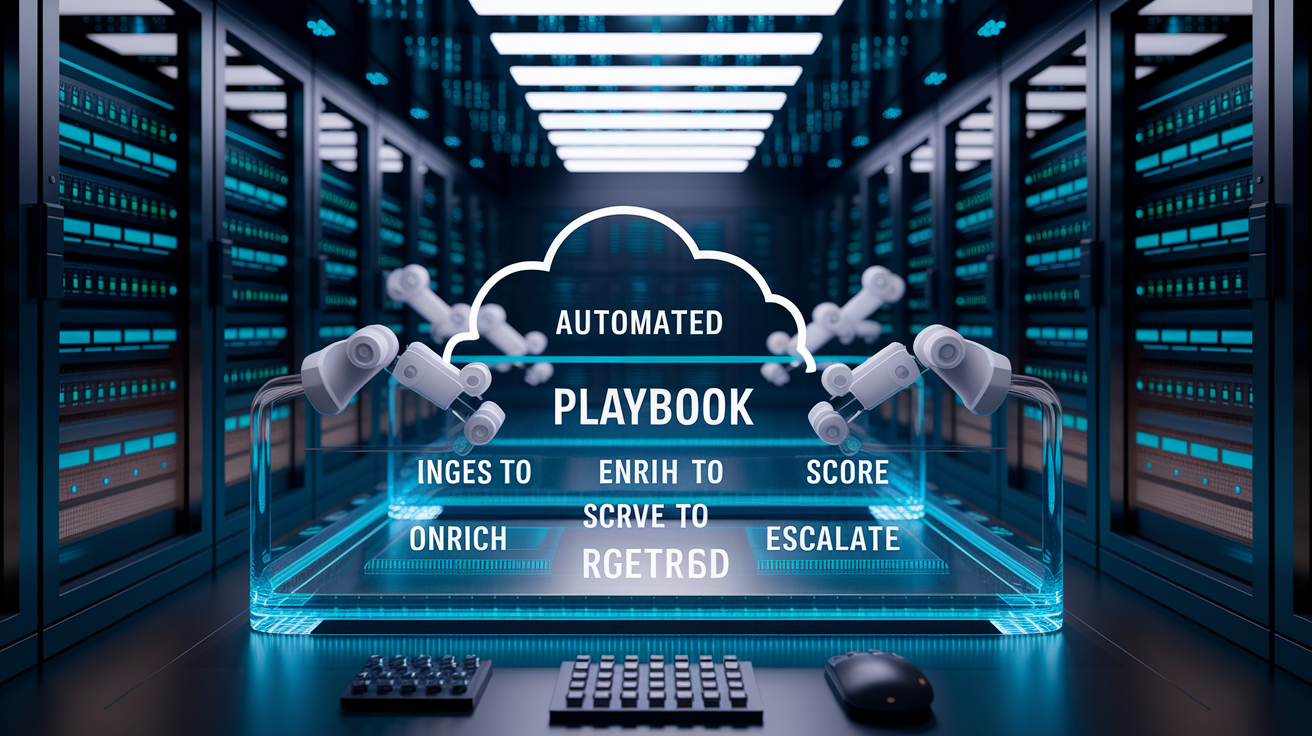
Automation is the only way to scale against millions of daily alerts. Security Orchestration, Automation, and Response platforms integrate with SIEM, CSPM, and cloud-native monitoring to execute playbooks that automatically classify, enrich, and route alerts based on predefined logic. The goal? Offload low and medium-risk responses so analysts focus on incidents that need investigation, context, and judgment. Things like temporarily disabling a user account after unusual API activity. Correcting a misconfigured firewall rule that exposes an S3 bucket. Blocking outbound traffic to a known malicious IP. Quarantining an EC2 instance showing signs of cryptomining. Automation has to match your risk tolerance. Some organizations prefer fully automated remediation for specific alert classes. Others require human approval for actions that could disrupt production workloads.
Automated prioritization workflows start by ingesting alerts from multiple sources: CloudWatch, Azure Monitor, CSPM scans, runtime agents, SIEM correlation rules. Each alert gets enriched with asset metadata, IAM context, telemetry snapshots, threat intelligence. A scoring engine applies risk factors to calculate priority. Alerts that exceed a Critical threshold trigger immediate escalation to on-call rotations, often bypassing standard queues entirely. Some platforms call these DUETs (Did yoU Expect This?). Warning-tier alerts get routed to analyst queues with defined SLAs. Informational alerts are logged for audit purposes or suppressed if they match known-good patterns. The system continuously learns from analyst feedback. When a human overrides a score, downgrades an alert, or marks a pattern as false positive, that signal feeds back into tuning logic.
Automated remediation actions need to be explicit, reversible where possible, and logged for compliance. Common actions include disabling compromised accounts, revoking overly permissive IAM policies, applying network ACLs to block suspicious traffic, quarantining instances for forensic analysis, removing malicious files or email, updating security group rules to close unintended exposure. Each action should include a rollback mechanism and audit trail. If an automated playbook disables a user account due to a spike in failed login attempts, the system should notify the user, log the action with timestamps and justification, provide a one-click restoration path if the activity is later confirmed as legitimate.
To design an automated prioritization workflow:
Centralize alert ingestion. Pull all cloud alerts, CSPM findings, runtime events, IAM anomalies into a single orchestration layer with normalized schema and metadata tagging.
Define scoring logic. Use risk factors (asset criticality, exploitability, IAM exposure, runtime evidence, business impact) to calculate a composite priority score for each alert. Map score ranges to severity tiers: Critical, Warning, Informational.
Create tiered playbooks. Build runbooks for each severity tier. Critical triggers immediate escalation and optional autoremediation. Warning routes to analyst queues with SLA timers. Informational logs or suppresses based on whitelist rules.
Implement approval gates. For high-impact actions like account suspension, resource quarantine, production firewall changes, require human approval via Slack, ticketing systems, or SOC dashboards before execution.
Test with backtesting and beta phases. Validate automation logic by running playbooks against historical alert datasets (backtesting) and in isolated live environments (beta testing) to measure false positive rates, response times, unintended disruptions before full deployment.
Contextual Enrichment to Improve Cloud Alert Severity Ranking

Raw alerts don’t have the context you need for accurate prioritization. An alert that says “High CPU usage on EC2 instance i-abc123” is meaningless without knowing whether the instance runs a customer-facing application, whether the spike aligns with a scheduled auto-scaling event, whether the IAM role attached has broad permissions, whether the instance has recently shown other anomalies. Contextual enrichment solves this by automatically attaching metadata and telemetry at the moment an alert is generated. Instance ID, type, region. Current and historical CPU, memory, network usage. Recent deployment or configuration changes. IAM actions logged in CloudTrail. Application logs showing requests or errors. Threat intelligence data like IP reputation scores, known indicators of compromise (IOCs), indicators of attack (IOAs), mapped tactics, techniques, procedures (TTPs) from frameworks like MITRE ATT&CK.
Enrichment cuts investigation time and improves scoring accuracy. When an analyst opens a high-priority alert, they immediately see whether the affected resource is in production, whether it handles sensitive data, whether the triggering behavior is anomalous compared to baseline, whether external threat intelligence flags the source IP or domain. This context enables faster, more confident decisions: escalate, contain, or dismiss. You don’t need to pivot between multiple consoles or tools. Enrichment also powers automated scoring. A policy violation on a dev instance with no sensitive data? Ranked lower than the same violation on a production database. An outbound connection to a known C2 server? That immediately escalates an alert even if CPU usage is normal.
Seven types of contextual data that improve cloud alert prioritization:
Asset inventory metadata. Instance ID, type, region, VPC, tags (environment, application, owner), creation date to identify resource purpose and criticality.
Runtime telemetry. CPU, memory, disk I/O, network throughput, session counts over time to detect anomalies and correlate resource behavior with alert timing.
Deployment and configuration history. Recent changes from IaC pipelines, manual console edits, auto-scaling events, patch cycles to distinguish expected changes from suspicious modifications.
IAM activity logs. CloudTrail or Azure Activity Log entries showing API calls, permission grants, credential use, role assumptions to trace identity involvement and privilege escalation paths.
Application and system logs. Error messages, request patterns, authentication failures, application-level events to understand workload behavior and validate or refute alert hypotheses.
Threat intelligence feeds. IP reputation databases, domain blocklists, CVE exploit timelines, IOC/IOA repositories, OSINT sources to correlate alerts with known attacker infrastructure and tactics.
Historical incident data. Past alerts, resolved incidents, remediation actions on the same resource or similar patterns to identify repeat offenders, assess likelihood of false positive, inform prioritization.
Alert Correlation and Deduplication Strategies for Cloud Environments

Multi-cloud environments generate alerts from AWS CloudWatch, Azure Monitor, GCP Cloud Logging, CSPM scans, endpoint agents, SIEM correlation rules. All using different taxonomies, severity scales, metadata schemas. Without correlation, a coordinated attack looks like isolated, low-priority events scattered across consoles. Correlation stitches these fragments into a unified incident narrative. A spike in API calls to an AWS S3 bucket from IP addresses in Eastern Europe, followed by failed Azure AD login attempts in Western Europe, followed by unexpected outbound traffic from a GCP Compute Engine instance in Asia to an unknown IP. When you correlate by time window, affected user, threat intelligence? That reveals a coordinated lateral-movement campaign that would be invisible in siloed alert queues.
Deduplication prevents alert fatigue by grouping repetitive notifications that share a common root cause. If a misconfigured security group exposes 50 EC2 instances, a naive alerting system fires 50 individual alerts. Deduplication clusters these by the failing control (security group rule) and presents a single high-priority recommendation with a list of affected resources. This reduces noise, accelerates remediation (fix the root cause once via Infrastructure as Code), prevents analysts from triaging the same issue 50 times. Suppression filters expected events like scheduled batch jobs that temporarily spike resource usage or maintenance windows where certain alerts are irrelevant. Analysts don’t get distracted by known-good activity. Normalization translates disparate alert schemas into a unified taxonomy (severity, category, resource type, action required) so multi-cloud operations can apply consistent prioritization logic across AWS, Azure, GCP.
| Technique | Purpose |
|---|---|
| Correlation | Link alerts across time, user, resource, threat intelligence to surface coordinated attacks and multi-stage incidents that appear benign in isolation |
| Deduplication | Group repetitive alerts by shared root cause (misconfiguration, failing control, IAM policy) to reduce volume and enable bulk remediation via IaC or policy change |
| Suppression | Filter alerts during maintenance windows, auto-scaling events, or from known-good sources (CI/CD pipelines, monitoring probes) to eliminate expected noise |
| Normalization | Translate alerts from AWS, Azure, GCP, third-party tools into a unified schema with consistent severity, category, metadata fields for cross-cloud prioritization |
Machine Learning and Behavioral Techniques for Prioritizing Cloud Alerts

Machine learning reduces alert volume from millions per day to a manageable set of high-fidelity incidents by learning what “normal” looks like and flagging deviations. Supervised learning models train on labeled historical incidents: alerts that were escalated, resolved as true positives, dismissed as false positives. They use those labels to predict which new alerts warrant immediate attention. Unsupervised clustering algorithms group alerts by similarity (resource type, behavior pattern, source IP, time of day) without predefined labels, surfacing outlier clusters that represent novel attack patterns or configuration drifts. Anomaly scoring engines assign each alert a probability score based on how far the triggering event deviates from established baselines. API call volume, login location, data transfer size, privilege usage. They prioritize alerts with the highest anomaly scores.
Behavioral baselines are built by profiling normal activity over time. Typical CPU usage for each instance type, standard API call patterns for each IAM role, expected network flows between VPCs, routine deployment cadences. When an event falls outside these baselines, ML models calculate a deviation score and correlate it with threat intelligence, asset criticality, recent IAM changes to produce a final priority ranking. A sudden spike in S3 GetObject API calls from a role that typically performs PutObject operations, combined with a source IP flagged in threat feeds? That triggers a high-priority alert even if the raw event count is below a static threshold. This dynamic, context-aware approach eliminates the need to manually tune thousands of static thresholds across a sprawling multi-cloud estate.
Pattern recognition extends beyond single-event anomalies to identify attack chains. ML models detect sequences like reconnaissance (ListBuckets, DescribeInstances) followed by privilege escalation (AssumeRole, AttachUserPolicy) followed by data exfiltration (high-volume GetObject calls to an external IP). These multi-step patterns are invisible to rule-based detection but stand out in behavioral analysis. Clustering also reveals misconfigurations that generate repeated false positives, enabling automated suppression or remediation suggestions.
Six benefits of ML-driven alert prioritization:
Automatic baseline learning. Models continuously update baselines as cloud environments evolve (new workloads, scaling events, legitimate behavior changes) without manual recalibration.
Noise reduction at scale. Filters millions of low-priority alerts by identifying normal variance and suppressing events that fall within expected distributions.
Novel threat detection. Unsupervised clustering surfaces attack patterns that don’t match predefined rules, catching zero-day tactics and insider threats.
Dynamic threshold adaptation. Adjusts alert thresholds in real time based on recent activity trends, seasonal patterns, deployment cycles. Reduces false positives during legitimate change windows.
Faster analyst triage. Presents analysts with a ranked queue where top-priority alerts have the highest anomaly scores, asset criticality, threat-intelligence correlation. Cuts mean time to acknowledge.
Feedback loop integration. Learns from analyst decisions (escalate, dismiss, adjust severity) to refine scoring models and improve future prioritization accuracy.
SIEM Tuning and Cloud-Native Detection Optimization

SIEM platforms centralize log ingestion, correlation, alerting across cloud providers. But out-of-the-box detection rules generate high false-positive rates without tuning. Effective SIEM tuning for cloud environments involves adding exceptions for trusted sources (CI/CD service accounts, monitoring probes), adjusting event count thresholds to match actual usage baselines, refining query filters to exclude benign activity (auto-scaling, scheduled batch jobs), modifying risk scores to down-weight alerts on non-production resources or up-weight alerts on sensitive data stores. Continuous tuning is essential because cloud environments change frequently. New services launch, workloads migrate, providers update APIs. Detection rules must adapt or become noisy and unreliable.
Four signals indicate that detection tuning is overdue. Sudden spikes in alert volume without corresponding infrastructure changes. High false-positive rates where analysts repeatedly dismiss the same alert type. Cloud environment changes (new region, new service, IaC rollout) that trigger legacy rules. Cloud provider feature updates or API behavior changes that invalidate rule assumptions. When these signals appear, teams initiate a tuning cycle that includes reviewing recent false positives, analyzing alert distribution by severity and resource type, consulting CloudTrail or activity logs to understand what triggered the noise.
The detection lifecycle formalizes tuning as a continuous process. It starts with ideation. Identifying detection gaps from customer security activity, strategic threat hunts, vendor security advisories, anomaly clustering, penetration test findings. Development follows, where detection engineers use rule engines (some platforms use Golang-based engines) to draft detection logic, define triage steps, specify AI or workflow integrations, map findings to frameworks like MITRE ATT&CK. Backtesting validates the rule against historical log data across multiple environments to measure fidelity and false-positive rate. Beta testing deploys the rule in a live sample environment (often a non-production account or a subset of production workloads) to monitor real-world performance, SOC response time, customer feedback. Once validated, the rule moves to full deployment with continuous monitoring for anomalies, volume spikes, feedback indicating further refinement is needed. Managed SIEM and MDR services offload this engineering burden, providing continuous rule updates and 24×7 detection tuning as part of the service.
Six steps in the detection lifecycle:
Ideation. Identify detection gaps from threat intelligence bulletins, customer incident reviews, penetration test findings, anomaly reports, cloud provider security advisories.
Development. Draft detection logic using rule engines, define triage playbooks, integrate enrichment sources (threat intel, asset inventory, IAM context), map to MITRE ATT&CK tactics and techniques.
Backtesting. Run the rule against historical log datasets from multiple cloud environments to measure true positive rate, false positive rate, coverage of known incidents.
Beta testing. Deploy the rule in a controlled live environment (non-prod or limited prod scope) to validate performance under real traffic, measure SOC response time, collect analyst feedback.
Deployment. Promote the rule to full production across all environments with documented triage steps, escalation paths, SLA expectations for each severity tier.
Continuous monitoring. Track alert volume, false positive rate, analyst feedback, environmental changes. Iterate on thresholds, exceptions, query logic to maintain fidelity as the cloud estate evolves.
Identity and Access Signals for Prioritizing Cloud Alerts

Identity risks are among the highest-impact security exposures in cloud environments because compromised credentials or overly permissive roles enable lateral movement, privilege escalation, data exfiltration across multiple services. Cloud Identity and Entitlement Management tools analyze IAM configurations and usage patterns to surface risks like missing multi-factor authentication on high-privilege accounts, unused policies that grant broad permissions but show no activity in CloudTrail logs, inactive users or roles that remain enabled beyond offboarding, access key misuse such as long-lived keys, keys in source code, keys used from unexpected geographic locations. These identity signals feed directly into alert prioritization. An alert involving a user with admin privileges and no MFA ranks higher than the same alert on a read-only service account.
CIEM platforms compare granted permissions against actual API usage to generate least-permissive policy suggestions. Refined IAM policies that include only the actions a user or role has invoked over a trailing period (typically 90 days). These suggestions can be pasted directly into AWS IAM or Azure AD to tighten permissions and reduce future alert volume. Insider threat detection correlates IAM anomalies like a user suddenly accessing resources outside their normal scope, assuming roles they’ve never used, invoking sensitive APIs (DeleteBucket, ModifyDBInstance) after a recent termination notice. It correlates these with workload behavior to prioritize alerts that indicate malicious intent rather than configuration drift.
Five identity signals that improve cloud alert prioritization:
Missing MFA on privileged accounts. Users or roles with admin, security, billing permissions lacking MFA present high blast radius and should escalate related alerts to Critical severity.
Unused permissions and inactive roles. Policies granting broad access but showing no CloudTrail activity are candidates for removal. Alerts on these identities are deprioritized or auto-remediated by revoking unused grants.
Access key hygiene violations. Long-lived keys (>90 days), keys exposed in public repositories, keys used from IPs outside expected geographies trigger high-priority alerts and immediate rotation workflows.
Privilege escalation events. IAM actions like AttachUserPolicy, CreateAccessKey, AssumeRole from unexpected sources or at unusual times indicate potential compromise and receive top-tier prioritization.
Cross-region or cross-account anomalies. Identity usage from regions where the organization has no infrastructure, or role assumptions into accounts outside normal patterns, signal lateral movement or reconnaissance.
Metrics and KPIs That Define Alert Prioritization Quality

Effective prioritization strategies must be measurable. SOC teams track key performance indicators to validate that noise is decreasing, critical threats are surfacing faster, analyst efficiency is improving. Alert volume is the starting metric. Total alerts per day or week, broken down by severity tier and source (CSPM, SIEM, runtime, identity). A successful prioritization strategy reduces total volume over time by suppressing false positives, deduplicating root causes, tuning detection rules. False positive rate measures the percentage of escalated alerts that analysts dismiss without action. High rates indicate poor enrichment, inadequate tuning, missing suppression rules.
Mean time to acknowledge, mean time to detect, mean time to respond are response-speed KPIs. MTTA tracks how quickly an analyst begins investigating an alert after it enters the queue. Effective prioritization surfaces Critical alerts immediately and queues lower-priority alerts with clear SLAs, reducing MTTA for high-severity incidents. MTTD measures the delay between an initial security event and alert generation. Well-tuned detections minimize this window. MTTR captures the full lifecycle from alert to remediation. Automated playbooks and enriched context dramatically reduce MTTR by eliminating manual investigation steps. Escalation count tracks how many alerts require human review versus automated resolution. A rising automation percentage indicates successful offloading of low and medium-risk responses.
Real-world case studies provide benchmarks. One organization saved approximately $1,000,000 in cost avoidance by implementing 24×7 managed detection and response with automated prioritization, eliminating the need to hire and train a full internal SOC. Another onboarded a large enterprise cloud environment in seven days using centralized alert ingestion and pre-tuned detection rules. A third reported 10 to 15% efficiency gains in merger and acquisition security assessments by applying risk-based prioritization to consolidate alerts across newly acquired cloud accounts.
Six KPIs that define prioritization quality:
Alert volume trend. Total alerts per day/week and distribution by severity tier. Successful strategies show declining volume as tuning and deduplication mature.
False positive rate. Percentage of escalated alerts dismissed without action. Target <10% for Critical alerts, <20% for Warning alerts.
Mean time to acknowledge. Seconds or minutes from alert generation to analyst triage start. Prioritization should drive MTTA below 5 minutes for Critical alerts.
Mean time to remediate. Minutes or hours from alert to full containment and resolution. Automation and enrichment reduce MTTR by 50% or more compared to manual workflows.
Escalation and automation ratio. Percentage of alerts resolved automatically versus requiring human review. Mature programs automate 60 to 80% of low and medium-risk alerts.
Coverage of critical assets. Percentage of high-value resources (production workloads, databases with sensitive data, admin roles) with active, tuned detection rules and prioritized alerting.
Final Words
In the action: centralize monitoring, apply repeatable triage, enrich telemetry, automate safe responses, and tune rules so teams see fewer noisy alerts and faster investigations.
Use risk-driven scoring, correlation and ML to move true threats to the top, and treat identity signals and SIEM tuning as ongoing work—not one-off tasks.
These cloud security alert prioritization strategies cut alert fatigue, improve MTTR, and make SOC decisions clearer. With steady tuning and governance, you get fewer surprises and more time to fix the real problems.
FAQ
Q: What are the core principles for prioritizing cloud security alerts?
A: The core principles for prioritizing cloud security alerts are centralize monitoring, structured triage, contextual enrichment, automation for low-risk items, continuous rule tuning, and long-term planning to align alerts with business risk and SLAs.
Q: How do I reduce alert fatigue in cloud environments?
A: Reducing alert fatigue requires centralizing alerts, deduplicating related events, enriching with context, automating low-risk responses, tuning detection rules, and using ML filters to surface truly actionable items for analysts.
Q: What is a risk-driven prioritization model for cloud alerts?
A: A risk-driven prioritization model ranks alerts by exploitability, asset criticality, exposure, runtime evidence, and business impact so teams focus on incidents that can actually harm services or data.
Q: Which factors should be used to compute dynamic risk scores?
A: Dynamic risk scores should use asset criticality, exploitability, IAM exposure, runtime telemetry (CPU, netflow, deploy history), and estimated business impact to change priority as evidence evolves.
Q: When should alerts be automated and what actions are typical?
A: Alerts should be automated for low- and medium-risk cases; typical actions include disabling accounts, blocking outbound traffic, quarantining hosts, and fixing firewall rules, with human approval gates for high‑risk responses.
Q: What does contextual enrichment mean and which sources help most?
A: Contextual enrichment means attaching metadata like instance ID, region, CPU/memory trends, deployment history, CloudTrail/CloudWatch logs, IAM activity, and threat intel to make severity and investigation faster and more accurate.
Q: How do you correlate and deduplicate alerts across multi-clouds?
A: Correlating and deduplicating alerts groups events by root cause, normalizes taxonomy across providers, applies suppression windows for expected activity, and links related telemetry to reveal coordinated or repeated incidents.
Q: How can machine learning improve alert prioritization?
A: Machine learning improves prioritization by recognizing patterns, building baselines, scoring anomalies, clustering related alerts, and reducing volume, while requiring labeled incidents, backtesting, and continuous model tuning.
Q: How should SIEM and detection rules be tuned for cloud?
A: SIEM and detection rules should be tuned through ideation, development, backtesting on historical data, beta testing, deployment, and continuous monitoring—adjusting thresholds, filters, and exceptions to cut false positives.
Q: Which identity signals matter most for alert priority?
A: Identity signals that matter include missing MFA, unused or over-privileged roles, access key misuse, anomalous sign-ins or privileged escalations, and IAM activity tied to sensitive workloads or data access.
Q: What KPIs show whether prioritization is working?
A: KPIs that show prioritization quality include alert volume, false positive rate, mean time to acknowledge (MTTA), mean time to detect (MTTD), mean time to respond (MTTR), and severity distribution versus SLAs.