

Is your team still treating GCP Security Command Center alerts like email, triaging whenever there’s time?
SCC findings run constantly and can mean active compromise, misconfigurations, or harmless noise.
This guide lays out a clear, actionable alert response process you can run today: map severity, validate findings, scope impact, contain fast, remediate, document, and verify closure.
You’ll get concrete triage rules, investigation steps using Cloud Audit Logs and VPC Flow Logs, sample playbooks for compromised VMs and service accounts, and automation patterns using Pub/Sub and Cloud Functions.
Bottom line: handle SCC alerts faster and with less guesswork.
End-to-End Alert Handling Workflow for Security Command Center Findings
Security Command Center findings show up from multiple detection sources that run nonstop across your organization. Event Threat Detection analyzes Cloud Audit Logs, VPC Flow Logs, and DNS queries as they happen. Security Health Analytics scans configuration state for policy violations. Each finding comes with metadata that drives triage, asset identifiers, IAM bindings, network context, and timestamps that help you filter out the noise.
A working alert workflow maps each finding to a severity tier, sets SLA targets, and sends the finding to the right team or automation pipeline. Critical findings (P0) need immediate human attention and trigger pages. High-priority findings (P1) hit the SOC queue within the hour. Medium findings (P2) wait for batch review within 24 hours. This keeps alert overload in check while making sure every confirmed threat gets handled.
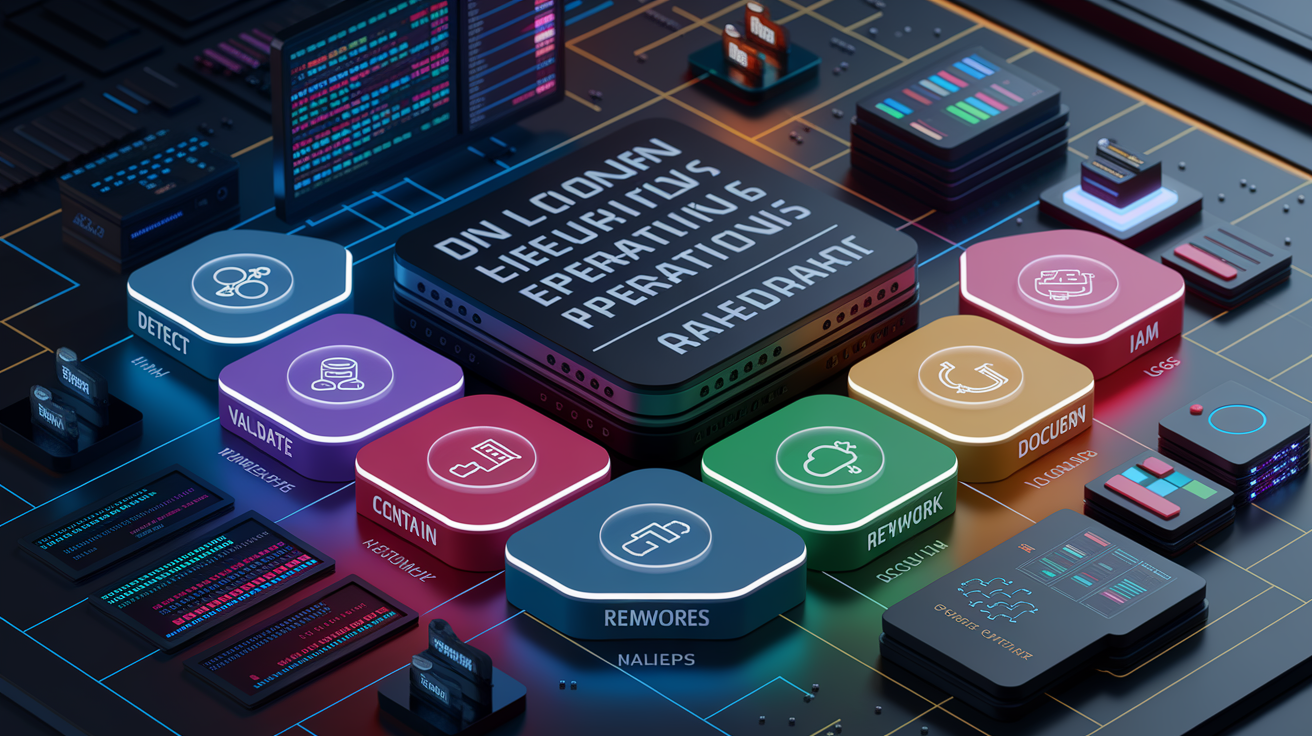
The unified response process follows seven steps that apply to every alert:
- Detect: SCC generates a finding and publishes it to Pub/Sub. The finding appears in the SCC dashboard and triggers any configured notifications.
- Validate: Review the finding’s sourceProperties, asset details, and timestamps to confirm the activity is suspicious and not a known maintenance task or authorized change.
- Scope: Identify all affected projects, VMs, service accounts, or network segments. Collect recent Cloud Audit Logs and VPC Flow Logs for those resources.
- Contain: Isolate compromised assets by updating firewall rules, disabling service accounts, or snapshotting VMs before they’re modified.
- Remediate: Rotate credentials, revoke excessive IAM grants, patch vulnerable configurations, or restore from a clean backup.
- Document: Update the finding’s state to ACTIVE or INACTIVE via PATCH. Attach evidence links and a brief timeline to the incident ticket.
- Verify: Confirm the remediation closed the vulnerability by re-running the same SCC detector or checking that the finding no longer reappears.
Pub/Sub notifications make near-real-time routing possible. Findings flow into Cloud Functions or Cloud Run services that enrich context, create tickets, and execute low-risk containment actions automatically.
Severity Mapping and Triage Logic for SCC Alerts

Tiering determines how fast a team responds and which automation logic runs. The simplest operational model uses three tiers with fixed SLAs. Critical findings (P0) represent active exploitation, lateral movement, or data exfiltration in progress. Fifteen-minute response means someone is paged and looking at logs within a quarter hour. High-priority findings (P1) indicate misconfiguration or anomalous behavior that could lead to compromise, these enter the queue within one hour. Medium findings (P2) flag policy drift or low-risk posture issues that can wait up to 24 hours for review.
Escalation triggers include confirmation of lateral movement, detection of data leaving a restricted VPC, or repeated failed authentication from an unusual source IP. When any of these patterns appear in sourceProperties, the finding is promoted to P0 regardless of its initial severity label. Automated queues handle low-risk, high-confidence actions like muting known safe findings or revoking public bucket ACLs. Manual queues receive anything that requires forensic analysis, cross-project correlation, or changes to production IAM policies.
| Severity Tier | SLA | Typical Actions | Example Alert Type |
|---|---|---|---|
| Critical (P0) | 15 minutes | Page SOC, isolate VM, disable service account, collect forensic snapshot | Cryptomining, data exfiltration, brute-force SSH success |
| High (P1) | 1 hour | Investigate logs, revoke excessive IAM grants, update firewall rules | IAM anomaly, suspicious API usage, public bucket ACL |
| Medium (P2) | 24 hours | Queue for batch review, apply mute rule if known false positive, update security marks | Open firewall to 0.0.0.0/0, missing encryption at rest |
Investigation Techniques Using Cloud Audit Logs and VPC Flow Logs

Validation starts by collecting the raw log entries that triggered the SCC finding. Cloud Audit Logs reveal who made an API call, when, and from which IP address. Admin Activity logs capture changes to IAM policies, firewall rules, and service configurations. Data Access logs show which principals read or wrote specific storage objects or BigQuery tables. VPC Flow Logs record every TCP or UDP conversation between instances, exposing unexpected network paths or data movement to external IPs.
For each finding, pull the principalEmail or serviceAccountEmail from sourceProperties and search Cloud Logging for all Admin Activity and Data Access entries from that identity in the past 24 hours. Check for recent IAM policy bindings granted to the account, especially roles/owner or roles/editor. Query VPC Flow Logs for source and destination IPs listed in the finding. Look for connections to RFC 1918 ranges you don’t own, or public IPs in countries where you have no infrastructure. If the finding references a DNS query, filter Cloud DNS logs by the query name and check which VM issued the request.
Evidence to extract during investigation:
- Principal identity (user email or service account key ID) and originating IP address
- Timestamp range covering the first suspicious event and any follow-on activity
- List of affected resources (project IDs, VM instance names, bucket names, dataset IDs)
- Recent IAM bindings or firewall rule changes made by the same principal
- Network flows showing data volume, destination IPs, and protocol details
Reconstruction of Incident Timeline
Sequence events by sorting log entries on timestamp, then group them by resource or principal. Start with the earliest Admin Activity entry that modified IAM or network policy. Follow with Data Access entries showing what the principal read or wrote. Finish with VPC Flow Logs that reveal where the data traveled. This chronological view exposes the attacker’s progression from initial access through privilege escalation to data movement, and it gives you the evidence needed to scope containment and confirm nothing was missed.
Sample Remediation Playbooks for Common SCC Alert Types
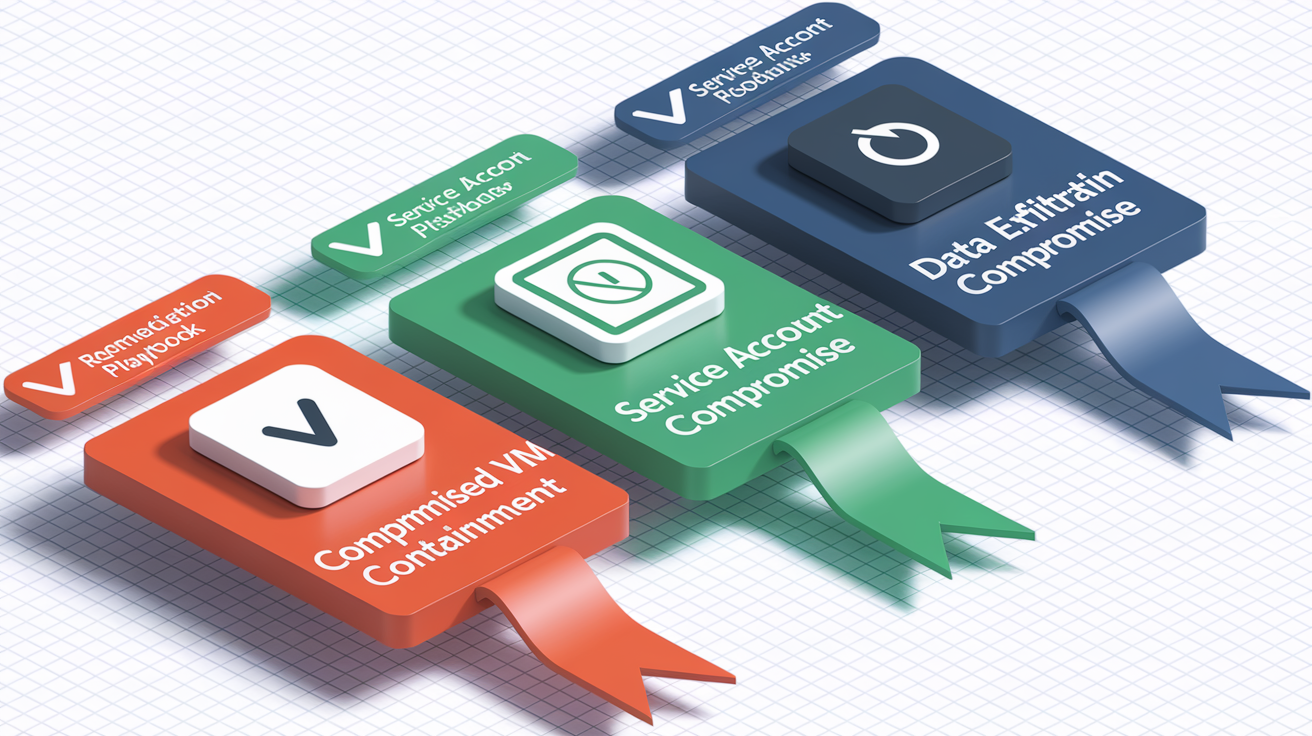
Compromised VM Containment
A finding that flags cryptomining or malware running on a Compute Engine instance requires immediate network isolation. The goal is to prevent further lateral movement while preserving the VM state for forensic analysis.
- Create a snapshot of the compromised VM’s boot disk and any attached persistent disks before making changes.
- Apply a new network tag (for example, “quarantine”) to the instance and create a firewall rule that denies all ingress and egress for that tag.
- Disable the instance’s service account or revoke its roles to prevent API calls from the compromised environment.
- Collect a memory dump if forensic tooling is available, then stop the instance and export its disk image to Cloud Storage for offline analysis.
Service Account Compromise
When ETD detects suspicious API usage from a service account, especially from an unexpected source IP or outside normal business hours, the priority is to revoke the account’s access and rotate its keys.
- List all active keys for the service account using
gcloud iam service-accounts keys listand note the key IDs in the finding’s sourceProperties. - Delete any keys that were created recently or appear in the suspicious API calls.
- Remove IAM bindings that grant the service account roles/editor, roles/owner, or any custom roles with write permissions.
- Review Cloud Audit Logs for all API calls made by the service account in the past 48 hours to identify any resources it modified or data it accessed.
Data Exfiltration Signals
Findings that report large outbound data transfers to public IPs or DNS queries to known command and control domains require rapid containment and evidence preservation.
- Identify the source VM or container from the finding’s resource name and isolate it using firewall deny rules or VPC Service Controls perimeter enforcement.
- Check Cloud Storage bucket IAM policies and remove any allUsers or allAuthenticatedUsers grants if the exfiltration involved object downloads.
- Query VPC Flow Logs for all connections from the source VM to external IPs in the same time window. Note destination IPs and total bytes sent.
- Disable the associated service account, rotate any credentials stored on the VM, and mark the finding as ACTIVE in SCC with a security mark indicating “under investigation.”
Automated Response Patterns Using Pub/Sub and Cloud Functions

The standard automation pattern routes SCC findings into a serverless processor that evaluates severity, enriches context, and executes pre-approved actions without human input. SCC publishes each finding to a Pub/Sub topic as soon as it’s created or updated. A Cloud Function or Cloud Run service subscribes to that topic, receives the finding payload in JSON, and decides what to do based on category and severity fields.
Functions that handle low-risk, high-confidence detections can remediate directly. Revoking a public bucket ACL, disabling a service account, or updating a security mark to suppress future noise. Higher-risk actions like isolating a production VM or rotating cryptographic keys should trigger a ticket creation and paging workflow instead. Always include a circuit breaker. If the function encounters an error or sees more than a threshold number of findings in a short window, it should halt automation and alert a human operator.
Example Serverless Responder Flow
A Cloud Function written in Python or Node.js receives the Pub/Sub message, decodes the finding JSON, and checks the category field. If the category is “serviceaccountkeynotrotated,” the function proceeds with automated remediation. If the category is “cryptomining” or “malware,” it creates a PagerDuty incident and exits.
- Decode the Pub/Sub message and parse the SCC finding JSON to extract the resource name, category, and sourceProperties.
- Call the Security Command Center REST API endpoint
GET https://securitycenter.googleapis.com/v1/{name}to retrieve the full finding details if the Pub/Sub payload is truncated. - Evaluate the category and severity. If automation is permitted for this combination, proceed to remediation logic.
- Execute the remediation API call (for example,
PATCHa bucket IAM policy orDELETEa service account key) and log the action to Cloud Logging. - Update the finding state to INACTIVE via
PATCH https://securitycenter.googleapis.com/v1/{name}?updateMask=stateand add a security mark recording the automation timestamp and function name.
Integrating SCC Findings into Incident Management Tools
Ticket creation pulls all the context a responder needs into a single artifact. The Pub/Sub-triggered function enriches the finding with asset metadata (project ID, region, VPC name, and current IAM bindings), then posts a structured payload to PagerDuty, Jira, or ServiceNow. The ticket includes a direct link to the SCC finding, embedded Cloud Audit Log queries, and a runbook reference keyed to the finding’s category.
SLA timers start when the ticket is created. P0 incidents escalate to on-call engineers if they aren’t acknowledged within five minutes. P1 tickets remain in the queue for one hour before escalation. P2 tickets batch into daily digest reports unless a manual review promotes them. Every integration should pass the finding’s severity, asset identifiers, and evidence links into predefined ticket fields so responders can jump straight to investigation without searching logs.
| Tool | Integration Method | Typical Use Case | SLA Support |
|---|---|---|---|
| PagerDuty | Cloud Function POST to Events API v2 | P0 and P1 incidents requiring immediate response | Built-in escalation and acknowledgment tracking |
| Jira | REST API issue creation with custom fields | P1 and P2 tracking, runbook attachment, evidence linking | Manual SLA enforcement via automation rules |
| ServiceNow | Incident API with categorization and priority mapping | Enterprise SOC workflows, compliance audits, change management | Native SLA timers and escalation policies |
| Slack | Webhook to post enriched finding summary | Real-time notifications to security channels, quick triage discussions | No SLA enforcement, notification-only |
Metrics, Dashboards, and Alert Fatigue Reduction for SCC

Tracking mean time to detect (MTTD) and mean time to remediate (MTTR) reveals whether the pipeline is keeping up with the SLA targets. MTTD measures the gap between when an event occurs and when SCC generates a finding. MTTR measures the time from finding creation to state change to INACTIVE. Both metrics should trend downward as automation improves and runbooks mature. False positive rate (calculated as muted findings divided by total findings) signals whether detection rules need tuning or enrichment filters.
Export SCC findings to BigQuery for historical analysis and custom dashboards. Cloud Monitoring charts can track daily finding volume by category, average response time by severity tier, and the count of findings that violated their SLA. When a category’s false positive rate exceeds 20 percent for two consecutive weeks, schedule a tuning sprint to refine detection logic or add mute rules for known safe patterns. When MTTR for P0 findings exceeds 30 minutes, investigate whether Pub/Sub delivery is delayed, whether runbooks are incomplete, or whether the on-call engineer needs additional training.
Alert fatigue reduction techniques:
- Apply mute rules to findings that represent accepted risk (for example, a test project with intentionally open firewall rules) after documenting the business justification.
- Use security marks to tag findings that have been investigated and confirmed safe, then filter these out of the active queue.
- Implement rate limits in Pub/Sub subscriptions so a burst of identical findings doesn’t trigger hundreds of duplicate tickets.
- Aggregate low-severity findings into daily or weekly digest emails instead of creating individual tickets for each one.
Testing, Simulated Alerts, and Continuous Improvement Using SCC Data

Regular testing validates that automation runs correctly and runbooks contain accurate step-by-step instructions. Monthly synthetic alerts inject known-bad configurations into a designated test project. Create a public Cloud Storage bucket, enable an open firewall rule, or simulate a brute-force SSH attempt using a script. These synthetic events should trigger findings, publish to Pub/Sub, create tickets, and execute any configured automation. Compare the actual response time and ticket content against the expected playbook output.
Quarterly tabletop exercises gather the SOC team, platform engineering, and on-call responders in a room and walk through a realistic incident scenario. Present a finding payload, ask participants to describe their next steps, and validate those steps against the documented runbooks. Update runbooks whenever the exercise reveals gaps: missing log queries, unclear escalation paths, or outdated API endpoints. Version-control all runbooks in a Git repository and treat playbook updates like code changes. Peer review, changelog entries, and rollback capability.
Testing workflow steps:
- Deploy a test project with minimal resources and enable all SCC modules (Event Threat Detection, Security Health Analytics, Container Threat Detection).
- Trigger a known alert type by creating a public bucket, granting allUsers access, or running a suspicious API call from a test service account.
- Verify the finding appears in the SCC dashboard within the expected detection window (typically under five minutes for ETD, under one hour for SHA).
- Confirm the Pub/Sub message arrives at the subscriber and that any automation executes the correct remediation action.
- Check that a ticket was created in PagerDuty, Jira, or ServiceNow with all required fields populated, including asset ID, severity, and runbook link.
Troubleshooting Common SCC Alert Response Issues
False positives often stem from detection rules that flag legitimate operational activity. Security Health Analytics might report a public bucket ACL for a static website hosting scenario you intentionally configured. Event Threat Detection may flag DNS queries to a third-party SaaS provider that your application uses daily. The fix is to add a mute rule scoped to the specific resource or project, then document why the finding is accepted risk. Never apply broad mute rules without investigating the finding first.
Noisy alerts occur when a single misconfiguration generates dozens of identical findings. Every object in a bucket might trigger its own PUBLICBUCKETACL finding. Tune detection by adding enrichment filters in the Pub/Sub processor. If the resource path matches a known pattern, suppress ticket creation and increment a counter instead. If the counter exceeds a threshold, create a single aggregate ticket. Pub/Sub delivery delays usually trace to subscriber acknowledgment timeouts that are too short. Increase the ack deadline to 60 seconds and add retry logic with exponential backoff. Permission errors during automation mean the Cloud Function’s service account lacks roles/securitycenter.findingsEditor or pubsub.publisher. Grant those roles at the organization level.
| Issue | Root Cause | Fix | Verification Step |
|---|---|---|---|
| Missing findings | SCC modules not enabled, log sources misconfigured, or API quota exceeded | Enable modules in SCC SETTINGS tab, verify Admin Activity, Data Access, VPC Flow, and DNS logs are flowing, check quota usage in Cloud Console | Trigger a test alert (public bucket ACL) and confirm it appears in Findings tab within one hour |
| Noisy alerts | Detection rule too broad, no enrichment filters, or repeated misconfigurations across multiple resources | Add Pub/Sub processor logic to deduplicate findings by resource prefix, create mute rules for known safe patterns, tune SHA detector settings | Monitor alert volume in Cloud Monitoring dashboard, confirm duplicate tickets are no longer created |
| Pub/Sub delivery delays | Subscriber ack deadline too short, function cold-start latency, or message backlog | Increase ack deadline to 60 seconds, add concurrency limits to prevent overload, check subscription backlog metric | Publish a test message to the SCC topic and measure time until Cloud Function logs the receipt |
| Permission errors | Cloud Function service account missing required IAM roles on organization or project | Grant roles/securitycenter.findingsEditor and roles/pubsub.subscriber at the organization level, verify with `gcloud projects get-iam-policy` | Trigger automation and check Cloud Function logs for successful API calls to update finding state |
Comprehensive Onboarding and Configuration Checklist for SCC

A complete setup makes sure every detection source is enabled and every log pipeline is configured before the first alert arrives. Begin by enabling Security Command Center at the organization level in the Google Cloud Console under Security > Security Command Center. Confirm the pricing tier (Standard for testing, Premium for Event Threat Detection and advanced modules). Verify that the Security Command Center API and the Cloud Asset API are enabled for the organization and all projects.
Configure per-project log sinks to route Cloud Audit Logs, VPC Flow Logs, and DNS logs into centralized storage. Set retention policies to at least 90 days for Admin Activity logs and 30 days for Data Access and flow logs. These windows give you time to investigate alerts and reconstruct incident timelines. Enable Event Threat Detection in the SCC SETTINGS tab and confirm that all required log types are flowing by checking log ingestion metrics in Cloud Logging. For Security Health Analytics, enable all standard detectors and review the list of policy checks to understand what will be flagged.
Onboarding tasks:
- Enable Security Command Center at the organization level and select the appropriate tier (Standard or Premium).
- Activate the Security Command Center API and Cloud Asset API for the organization.
- Configure centralized log sinks to route Audit, VPC Flow, and DNS logs to Cloud Logging or BigQuery.
- Enable Event Threat Detection and confirm log sources (Admin Activity, Data Access, VPC Flow, DNS) are ingesting data.
- Enable Security Health Analytics and review the full list of policy detectors in the SETTINGS tab.
- Create a Pub/Sub topic for SCC findings and subscribe a Cloud Function or Cloud Run service to process alerts.
- Grant the Cloud Function service account roles/securitycenter.findingsEditor, roles/pubsub.subscriber, and any additional roles needed for remediation actions (for example, roles/compute.instanceAdmin for VM isolation).
Final Words
We mapped detection through triage, investigation, containment, and remediation, showing the step-by-step process for Security Command Center findings.
You saw the severity tiers and SLAs, log-based investigation using Cloud Audit and VPC Flow Logs, automation patterns (Pub/Sub → Cloud Functions), and how to route findings into PagerDuty or Jira. The post includes playbooks, testing cycles, and metrics to cut alert fatigue.
Use this GCP Security Command Center alert response guide as a practical checklist: automate safe actions, enforce SLAs, and run regular exercises. Small steps will make response faster and more reliable.
FAQ
Q: What is the end-to-end alert handling workflow for Security Command Center findings?
A: The end-to-end alert handling workflow for Security Command Center findings follows detection → validate → collect asset metadata and logs → triage → contain → remediate → verify, using Pub/Sub for near-real-time notifications and PATCH updates.
Q: How should I map severities and SLAs in SCC?
A: The severity mapping uses a three-tier model: Critical/P0 (15 minutes), High/P1 (1 hour), Medium/P2 (24 hours); tiers determine escalation paths, automation versus manual handling, and SOC assignment.
Q: What logs and evidence should I collect when investigating SCC alerts?
A: The logs and evidence to collect when investigating SCC alerts include Cloud Audit Logs (Admin/Data Access), VPC Flow Logs, DNS logs, asset metadata, IAM bindings, and sourceProperties with IPs, domains, and identities.
Q: How do I reconstruct an incident timeline from logs?
A: Reconstruction of an incident timeline requires sequencing API calls, network flows, and DNS events by timestamp, correlating user/service identities, and linking findings to build a clear step-by-step attack narrative.
Q: What immediate containment and remediation steps are recommended for a compromised VM?
A: The immediate containment and remediation steps for a compromised VM are to isolate the VM, capture a forensic snapshot, revoke affected credentials, update firewall rules, and run post-remediation verification checks.
Q: How should I respond to a service account compromise?
A: The response to a service account compromise is to disable the account, rotate or revoke keys, audit recent API activity via Cloud Audit Logs, enforce least-privilege changes, and recreate or restore credentials as needed.
Q: How can I automate SCC responses with Pub/Sub and Cloud Functions?
A: Automating SCC responses with Pub/Sub and Cloud Functions routes findings to a function that GETs details, evaluates rules, PATCHes finding state, and triggers remediation actions or ticket creation programmatically.
Q: How do I integrate SCC findings into PagerDuty, Jira, or Slack?
A: Integrating SCC findings into PagerDuty, Jira, or Slack means enriching alerts with severity, asset ID, log links, and SLA metadata, then using Pub/Sub connectors or APIs to create and track tickets while preserving evidence fields.
Q: What metrics and techniques reduce alert fatigue for SCC?
A: Metrics and techniques to reduce alert fatigue include tracking MTTD and MTTR, monitoring false positive rates, tuning Security Health Analytics rules, applying deduplication and suppression, and exporting SCC data to BigQuery for analysis.
Q: How often should I test SCC workflows and what should tests include?
A: The testing cadence for SCC workflows should include monthly synthetic alerts and quarterly tabletop exercises; tests should simulate Pub/Sub payloads, validate runbooks, measure SLA adherence, and document lessons learned.
Q: What common troubleshooting steps fix noisy or missing SCC alerts?
A: Common troubleshooting for noisy or missing SCC alerts is to verify APIs and log sinks, check retention and ingestion, tune SHA detection rules, inspect Pub/Sub delivery, and confirm required roles and permissions are set.
Q: What are the key onboarding tasks to configure SCC correctly?
A: The key onboarding tasks to configure SCC correctly are enabling it at the organization level, verifying APIs, configuring per-project log sinks, enabling ETD and SHA modules, setting retention policies, and validating log ingestion.