

Benchmarks can be misleading—sometimes wildly so.
Manufacturers publish short, repeatable scores that show peak shader speed but skip VRAM pressure, denoiser cost, and long thermal stress.
That means a GPU with a higher advertised number can be identical or slower in real rendering, gaming, or long sessions.
This guide walks through practical tests you can run: representative workloads, monitoring, sustained-load runs, and how to compare your 1% lows to claimed scores.
Do this and you’ll know what performs in the real world, not just on paper.
Core Methods for Measuring Actual GPU Performance vs Benchmark Claims
Advertised benchmark scores are controlled snapshots of compute performance under perfect conditions. They don’t account for the messy reality of production workloads. Synthetic tests like 3DMark and Unigine Heaven measure raw throughput and shader execution speed in short, repeatable bursts. Real applications introduce variable VRAM usage, extended thermal stress, denoiser overhead, and scene bottlenecks that synthetic tools intentionally sidestep to maintain compatibility across a wide hardware range. This creates a gap where a GPU scoring 20% higher in Time Spy delivers identical or even slower performance in a VRAM-heavy rendering scene.
VRAM capacity and thermal behavior often dominate real outcomes more than raw compute power. When a scene exceeds available VRAM and spills data to system memory, render times can increase roughly three times compared to synthetic predictions. Independent of shader performance or clock speed. Long-duration loads expose thermal throttling and power limit behavior that 30-second synthetic tests never trigger. In a V-Ray caustics scene using progressive mode, VRAM consumption exceeded 24 GB. GPUs with 12 GB of VRAM (such as the RTX 5070) suffered severe slowdowns, while synthetic benchmarks had rated them as high performers because those tests avoid memory-intensive scenarios.
FPS averages hide critical stability issues that only appear in frame time and percentile data. A GPU reporting 90 average FPS can still stutter badly if its 1% low FPS drops to 30, creating a choppy experience that average metrics conceal. Frame time consistency matters more than peak throughput for interactive work. Monitoring tools like FrameView or CapFrameX reveal spikes and variances that marketing materials never mention.
Six-step practical testing workflow:
-
Select representative workloads — Choose three to five games or rendering scenes that match your actual use case. Include at least one VRAM-intensive scenario and one ray-tracing-heavy workload.
-
Standardize all settings — Lock resolution, quality presets, ray tracing toggles, and DLSS/FSR modes to fixed values. Document driver version, power mode, and ambient temperature.
-
Install monitoring overlays — Use FrameView, CapFrameX, or Rivatuner to capture FPS, frame times, 1% lows, VRAM usage, GPU temperature, and power draw in real time.
-
Log multi-pass results — Run each test three times to account for variance. Discard the first run if it includes shader compilation overhead.
-
Conduct sustained-load tests — Let the GPU run a demanding scene for 30 to 60 minutes to check for thermal throttling or performance degradation under extended use.
-
Compare measured data to manufacturer claims — Calculate the percent deviation between your logged 1% lows and the advertised benchmark score. Look for mismatches larger than 15%, especially in VRAM-sensitive or thermally constrained scenarios.
Understanding GPU Benchmark Types and Their Impact on Real-World Testing

Synthetic benchmarks deliver controlled, repeatable stress scenarios that isolate shader performance, memory bandwidth, and geometry throughput under carefully designed workloads. Tools like 3DMark and Unigine Heaven run short, GPU-focused loops that avoid VRAM overflow and skip denoising or post-processing overhead. They’re excellent for comparing raw compute capability across different architectures. The tradeoff is that they intentionally exclude the complexities that define real production environments. Variable asset sizes, unpredictable memory access patterns, and sustained thermal loads. Custom benchmarks built in-house can target narrow workflows, but they lack standardization and make cross-product comparisons difficult to interpret reliably.
Real tests run actual applications and games under typical usage conditions, exposing performance gaps that synthetic tools miss. Running Cyberpunk 2077 at 1440p with ray tracing enabled produced approximately 60 FPS on the NVIDIA GeForce RTX 4070 and approximately 45 FPS on the RTX 4060. That’s a practical performance gap between adjacent tiers that raw synthetic scores might underrepresent. Real tests capture frame-time consistency, VRAM spilling behavior, and driver-specific optimizations (or bugs) that evolve with game patches, making them a better predictor of day-to-day experience.
| Benchmark Type | Advantages | Limitations |
|---|---|---|
| Synthetic (3DMark, Heaven, Port Royal) | Repeatable, cross-platform comparable, fast to run, isolates GPU compute and memory bandwidth | Skips VRAM-heavy scenarios, denoisers, and long-duration thermal stress; may not reflect actual application performance |
| Real-World (Cyberpunk, Blender, V-Ray) | Reflects actual usage patterns, captures VRAM limits, thermals, and driver behavior; includes post-processing overhead | Results vary by driver version, game patch, and scene complexity; less standardized across tests |
| Custom (In-house rendering, AI training scripts) | Targets specific workflow requirements, can stress unique bottlenecks relevant to your pipeline | Lacks comparability, difficult to share or reproduce, may favor one architecture unintentionally |
GPU Workload Scenarios That Reveal Real-World Performance Differences
VRAM-intensive workloads are the first category that exposes the gap between synthetic scores and real performance. When a scene’s texture assets, geometry buffers, and intermediate render targets exceed available GPU memory, the system falls back to slower system RAM or begins swapping data across the PCIe bus. In a V-Ray caustics scene tested using progressive rendering mode, VRAM consumption exceeded 24 GB. Only the RTX 5090 in the test batch carried enough memory to avoid spillover. The 12 GB RTX 5070 fell far behind, experiencing render times roughly three times longer than synthetic benchmarks had suggested. Bucket-mode rendering of the same scene consumed approximately 18 GB, still pushing mid-range cards into memory-starved territory. These workloads reveal capacity limits that synthetic tools avoid by design.
Ray-tracing and denoiser-dependent workloads introduce computational overhead that exists outside the scope of most synthetic tests. Denoisers (such as Intel Open Image Denoiser on CPU or NVIDIA OptiX Denoiser on GPU) can represent a significant portion of total render time, especially in progressive workflows where the denoiser runs after each rendering pass. Synthetic benchmarks typically disable denoisers to maintain cross-vendor compatibility, hiding a major real performance factor. Some scenes also behave unpredictably. In one Blender test (Scanlands), four different GPUs produced nearly identical render times despite using less than 10 GB of VRAM and showing 100% GPU utilization. A behavior not explained by raw compute differences and not predicted by synthetic rankings.
Short-duration scenes and overhead-dominated tasks punish high-end GPUs by preventing them from using their higher compute throughput. Fixed per-frame setup costs, shader compilation, scene initialization, and subtask scheduling create a performance floor that faster hardware can’t overcome. Short-duration Blender scenes like Junkshop and Cozy Kitchen, along with V-Ray’s Cow Obduction Daytime, all showed poor scaling on higher-tier GPUs because the workload spent more time preparing to render than actually rendering. This category of workload is common in interactive previews, animation frame-by-frame rendering, and real-time editing contexts where synthetic long-duration stress tests provide no useful predictive value.
Five workload scenarios that often break synthetic expectations:
-
High-polygon scenes with 4K or 8K texture sets that exceed 12 GB VRAM and force system memory fallback
-
Progressive rendering with per-pass denoisers enabled, multiplying overhead in ways not reflected in raw-render benchmarks
-
Ray-traced caustics or global illumination in production render engines like V-Ray or Arnold, which stress memory bandwidth and cache behavior differently than gaming ray tracing
-
Short-duration animation frames or real-time preview renders where setup overhead dominates and high-end GPUs idle most of the time
-
Scenes with complex shader trees, procedural generation, or volumetric effects that depend on CPU-GPU synchronization and introduce unpredictable stalls
Key Metrics for Measuring Real-World GPU Behavior
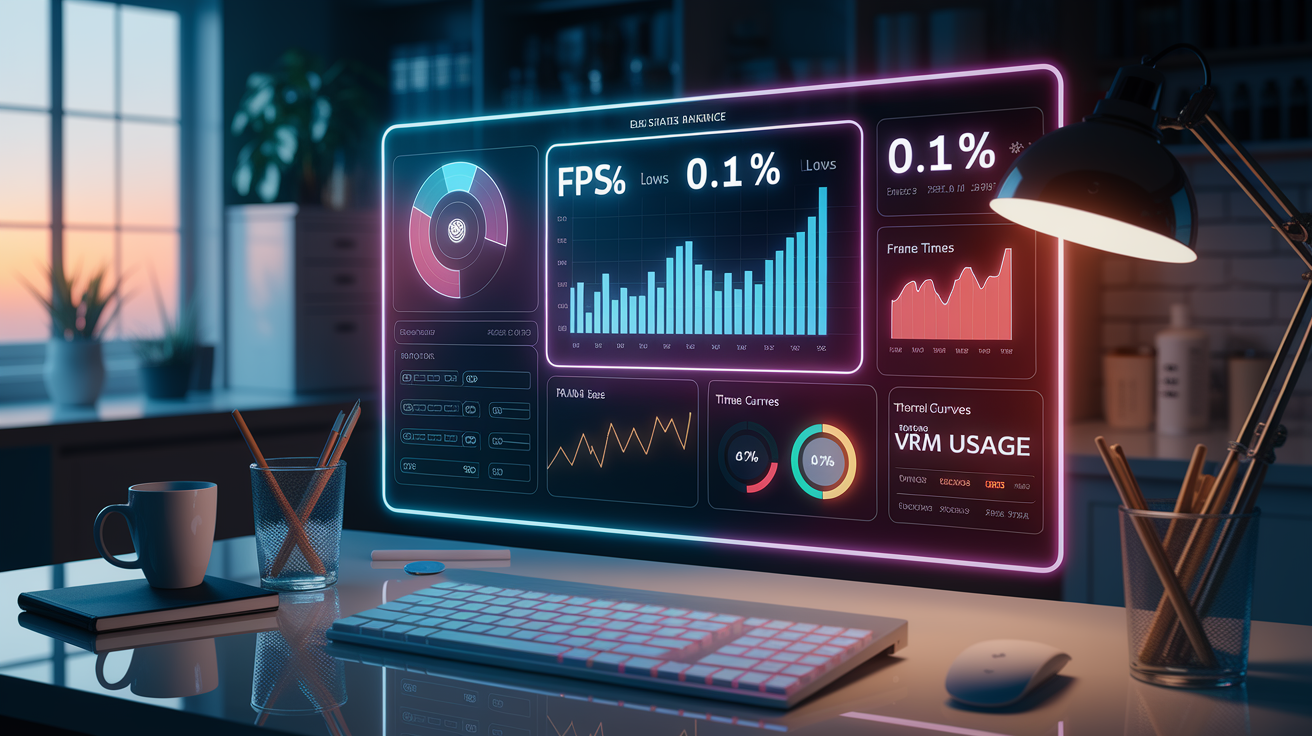
Average FPS provides a convenient headline number, but it conceals the frame-to-frame inconsistency that defines perceived smoothness. A GPU reporting 100 average FPS might still deliver a choppy experience if frame times swing wildly or if 1% low FPS drops into the 40s during particle-heavy scenes or shader compilation events. Frame time consistency, measured in milliseconds per frame, reveals stuttering that averages hide. The 1% low metric (the average of the slowest 1% of frames) and 0.1% low metric capture worst-case behavior during sudden load spikes, asset streaming, or garbage collection pauses. These percentile measurements are more reliable indicators of stability than synthetic benchmark scores, which often report only a single aggregated number.
Thermal throttling and power limit behavior emerge only under sustained load, making short synthetic tests poor predictors of long-session performance. Some processors and GPUs “stumble under long-term load,” maintaining advertised boost clocks for the first few minutes before thermal limits force frequency reductions. Monitoring tools like HWiNFO64, FrameView, and Rivatuner let users log GPU temperature, power draw, and clock speed over time, revealing whether a card sustains its rated performance or gradually degrades. Driver maturity also plays a role. Early drivers can lack optimizations for new titles, and performance can improve (or regress) with updates. Testing across driver versions and over 30-to-60-minute sessions captures behavior that five-minute synthetic loops never expose.
VRAM overflow is a binary performance cliff that synthetic benchmarks intentionally avoid. When scene data exceeds GPU memory and spills to system RAM, render times can increase by a factor of three or more. Regardless of shader performance or memory bandwidth specs. This creates a hard performance boundary that no amount of compute power can overcome. Logging VRAM usage alongside FPS and frame times with tools like CapFrameX or MSI Afterburner reveals when a card is memory-constrained versus compute-constrained, allowing users to diagnose whether a performance gap is due to insufficient VRAM, thermal limits, or CPU bottlenecks. Long-duration logging also exposes memory leaks, driver instability, and background process interference that short tests miss entirely.
Environmental and System Variables Affecting GPU Performance Outcomes
CPU pairing and platform architecture introduce variance that can rival or exceed GPU performance differences. In controlled GPU testing, a Threadripper 9970X host was used to eliminate platform-related bottlenecks and ensure that memory bandwidth, PCIe lanes, and CPU thread availability remained constant across all GPU comparisons. Some rendering scenes showed sensitivity to memory channel count. A customer scene produced approximately 10% performance differences between two 64-core platforms of the same generation, one using standard Threadripper and the other using Threadripper PRO with additional memory channels. This type of platform-dependent behavior doesn’t appear in GPU-only synthetic benchmarks and can lead users to misattribute performance gaps to the GPU when the limitation actually lies in system memory architecture or CPU-GPU synchronization overhead.
Driver maturity, game patches, ambient temperature, and case airflow all alter performance outcomes in ways that synthetic benchmarks don’t account for. A GPU tested in an open-air bench setup at 22°C can throttle significantly when installed in a poorly ventilated case at 28°C ambient temperature, reducing sustained clock speeds by 10% or more. Driver updates can improve (or degrade) performance in specific titles. Early drivers for a new GPU generation might lack game-specific optimizations that arrive months later. Reproducible test conditions require documenting driver version, power mode (balanced vs. performance), ambient temperature, case fan configuration, and background processes. Without these controls, test results become unreliable and difficult to compare across multiple testing sessions or different user setups.
Critical environmental controls for reproducible testing:
-
Fixed CPU platform, motherboard, RAM configuration, and power supply to eliminate platform variance
-
Documented driver version, operating system build, and power plan settings at the time of each test
-
Stable ambient temperature (±2°C) and consistent case airflow or open-air test bench setup
-
Closed background applications, disabled auto-updates, and consistent monitoring tool overhead across all test runs
Tools and Testing Methodologies for Accurate GPU Performance Evaluation
Accurate GPU evaluation requires a combination of real-time monitoring overlays, logging utilities, and post-test analysis tools that capture the metrics synthetic benchmarks ignore. MSI Afterburner and Rivatuner provide on-screen overlays showing GPU usage, VRAM allocation, clock speeds, temperatures, and FPS in real time, giving immediate feedback during test runs. CapFrameX and FrameView offer frame-time logging with percentile analysis, exporting CSV files that allow detailed examination of 1% lows, 0.1% lows, and frame-time variance across entire test sessions. HWiNFO64 sensors log power draw, thermal behavior, and voltage regulation data, revealing throttling events or power limit hits that affect sustained performance. Cross-validating results across multiple tools reduces the risk of measurement artifacts or software-specific bugs skewing conclusions.
Real scene selection must include a mix of VRAM-intensive, ray-tracing-heavy, and overhead-dominated workloads to expose the full range of GPU behavior. Rendering tests using Blender Cycles or V-Ray should include scenes that exceed 12 GB of VRAM (to test mid-range cards), scenes with progressive rendering and denoisers enabled (to measure post-processing overhead), and short-duration scenes (to capture setup costs). Gaming tests should cover both rasterization-heavy and ray-tracing-dependent titles, with fixed settings locked to eliminate variability from dynamic resolution scaling or frame generation technologies that can inflate FPS numbers without improving frame time consistency. Each test should be run at least three times, with the first run discarded if it includes shader compilation or asset streaming overhead unique to the initial launch.
Progressive rendering modes and denoiser placement introduce performance variables that synthetic benchmarks exclude. In V-Ray tests, bucket mode consumed approximately 18 GB of VRAM for a caustics scene, while progressive mode exceeded 24 GB. That demonstrates that render mode selection significantly affects memory footprint and performance scaling. Denoisers can run on either CPU or GPU and represent a measurable portion of total render time, especially in progressive workflows where denoisers execute after each pass. Testing both bucket and progressive modes with denoisers enabled and disabled isolates the performance impact of each component, revealing bottlenecks that raw-render benchmarks never capture. Results can vary widely depending on these configuration choices, driver maturity, and scene complexity, making cross-validation across synthetic and real tests essential for accurate interpretation.
Step-by-Step Testing Workflow
Start by selecting three to five representative workloads that match your actual use case. Include at least one VRAM-heavy scene (>16 GB), one ray-tracing-intensive scenario, and one short-duration task prone to setup overhead. Lock all test settings to fixed values: resolution, quality preset, ray-tracing toggles, DLSS or FSR modes, and V-sync off. Document your driver version, operating system build, power plan, and ambient temperature. Install FrameView or CapFrameX to log frame times, FPS, and VRAM usage. Configure HWiNFO64 to record GPU temperature, power draw, and clock speeds.
Run each test three times and discard the first run if it includes shader compilation or initial asset loading overhead. Log all results to CSV files for post-test analysis. After completing short-duration tests, conduct a sustained-load test by running your most demanding scene for 30 to 60 minutes, monitoring for thermal throttling, clock speed reductions, or performance degradation over time. Export frame-time data from CapFrameX and calculate 1% lows, 0.1% lows, and frame-time variance. Compare your measured VRAM usage, average FPS, and percentile metrics to the manufacturer’s advertised benchmark score. Calculate percent deviations. Discrepancies larger than 15% in VRAM-intensive or thermally constrained scenarios indicate a meaningful gap between synthetic claims and real behavior. Cross-check results against independent reviewer consensus from Hardware Unboxed, Gamers Nexus, or other sources that conduct multi-game, long-duration testing.
Identifying and Explaining Discrepancies Between Advertising Claims and Real Measurements
Performance gaps between advertised benchmark scores and real measurements arise primarily from five factors: VRAM capacity limits, progressive render overhead, denoiser costs, thermal throttling, and short-scene setup overhead. When a GPU’s advertised score comes from a synthetic test that avoids memory-intensive workloads, users encounter a performance cliff the moment their scene exceeds available VRAM. In tested scenarios, VRAM spillover to system memory caused render times to increase by a factor of three compared to synthetic predictions. Independent of shader performance or clock speed. This category of discrepancy is binary: the GPU either has enough memory or it doesn’t, and synthetic benchmarks intentionally sidestep this boundary to maintain compatibility across a wide range of hardware.
Progressive rendering modes and denoiser placement add computational overhead that synthetic tools exclude by design. Denoisers running on the CPU (Intel Open Image Denoiser) or GPU (NVIDIA OptiX Denoiser) can represent a significant portion of total render time, especially in workflows where the denoiser executes after each progressive pass. Synthetic benchmarks disable denoisers and typically use bucket rendering or single-pass workflows, creating a measurement gap where real production workloads run 20% to 40% slower than raw-render benchmarks suggest. Driver maturity also plays a role. Early drivers for new GPU architectures can lack game-specific optimizations, and performance can improve (or degrade) with updates. Thermal throttling under sustained load further reduces performance in long-session work, an issue that 30-second synthetic loops never expose.
Reviewer consensus from independent testing outlets like Hardware Unboxed and Gamers Nexus emphasizes multi-game, long-duration testing precisely because short synthetic tests hide these discrepancies. CPU bottlenecks, poorly optimized case airflow, and power limit enforcement all reduce sustained performance in ways that manufacturer-controlled test environments avoid. Scene-specific behavior also introduces unpredictability. Some Blender scenes showed multiple GPUs performing identically despite different compute capabilities, while short-duration V-Ray scenes failed to scale on high-end GPUs due to fixed overhead. These anomalies don’t appear in synthetic test suites, making real validation the only reliable method for verifying advertised claims and choosing hardware based on actual workflow requirements rather than controlled lab numbers.
Final Words
in the action, we showed why synthetic scores often miss real workload costs — VRAM limits, denoiser overhead, thermals, and long-duration stutters — and why metrics like 1% lows and frame times matter more than averages.
We walked through tools and a repeatable workflow: pick real workloads, lock settings, monitor with FrameView/CapFrameX, log frame times, run long tests, and compare to vendor claims.
Follow this approach and you’ll reliably spot gaps between marketing and reality. This is a practical guide on how to measure real-world performance vs benchmark claims in new GPUs.
FAQ
Q: How is GPU performance measured?
A: GPU performance is measured by average FPS, 1%/0.1% lows, frame-time consistency, synthetic benchmark scores (like 3DMark), compute throughput, memory bandwidth/VRAM usage, and thermal and power behavior under load.
Q: How to check if GPU is performing correctly?
A: To check if a GPU is performing correctly, monitor FPS, 1% lows, frame times, clock speeds, VRAM use, temperatures, and power; run synthetic and real-world benchmarks and use tools like FrameView, CapFrameX, and HWiNFO.
Q: How to measure benchmark performance?
A: To measure benchmark performance, run standardized synthetic and real-world tests with fixed settings, log FPS and frame times across multiple runs using overlays like FrameView or CapFrameX, then average and compare results to baselines.
Q: What are the 4 stages of benchmarking?
A: The four stages of benchmarking are selecting representative workloads, standardizing system and settings, running and logging tests (including long-duration runs), and analyzing results against synthetic baselines and manufacturer claims.